As a content writer here at OptinMonster, I constantly track the performance of my posts, so I can understand which ones are attracting visitors and getting engagement. This process can be overwhelming due to the massive amount of data available through tools like Google Analytics (GA4) and Google Search Console (GSC). Which website metrics should you track to optimize every part of your content marketing strategy?
In this article, I’ll share 12 site metrics that are important to monitor and give tips on how to improve or leverage each one. I’ll also explain how to use website analytics tools like GA4 and MonsterInsights to track those metrics.
What Are Website Metrics?
Website metrics are data points that help you understand how visitors interact with your site. These metrics provide insights into user behavior, such as how they find your website, what pages they visit, how long they stay, and what actions they take.
When you continually analyze your site metrics, you can discover what tactics are working and which ones aren’t. You can then identify areas for improvement and make data-driven decisions to improve your site’s performance.
Website metrics can be categorized into different types, including:
- Traffic Metrics: These measure the number of visitors and how they arrive at your site.
- Engagement Metrics: These track how users interact with your content, such as the time they spend on your site and the number of pages they view.
- Conversion Metrics: These focus on the number of visitors who complete a desired action, such as filling out a form, subscribing to your email list, or making a purchase.
- Technical Metrics: These evaluate the performance of your website, such as load times and mobile responsiveness.
Get More Engagement & Conversions With OptinMonster
Learn how OptinMonster helped Medstar Media increase their clients’ conversions by 500%!
It’s important to monitor all 4 types of website metrics. After all, driving traffic to your site is just the first step. If you want to win sales, you have to move visitors through the customer journey by getting them to stay on your site and click your calls-to-action (CTAs).
12 Important Website Metrics to Track to Grow Your Business!
Here are the most important website metrics to track if you’re getting started with performance analytics:
- Page Views
- Bounce Rate
- Unique Visitors
- Mobile vs. Desktop Visitors
- Traffic Sources
- Top Pages
- Top Landing Pages
- Top Exit Pages
- New Visitors
- Returning Visitors
- Page Load Times
- Average Time on Page
- More Website Metrics to Consider
1. Page Views
Page views are the first and most basic website performance metric to track. This metric is the total number of pages viewed on your site.
For example, let’s say 1000 visitors land on your site in a week, and each one views 2 different pages. Your pageviews for the week would be 2000.
Page views give you an understanding of your overall site traffic and a baseline to improve on.
How to Track Page Views:
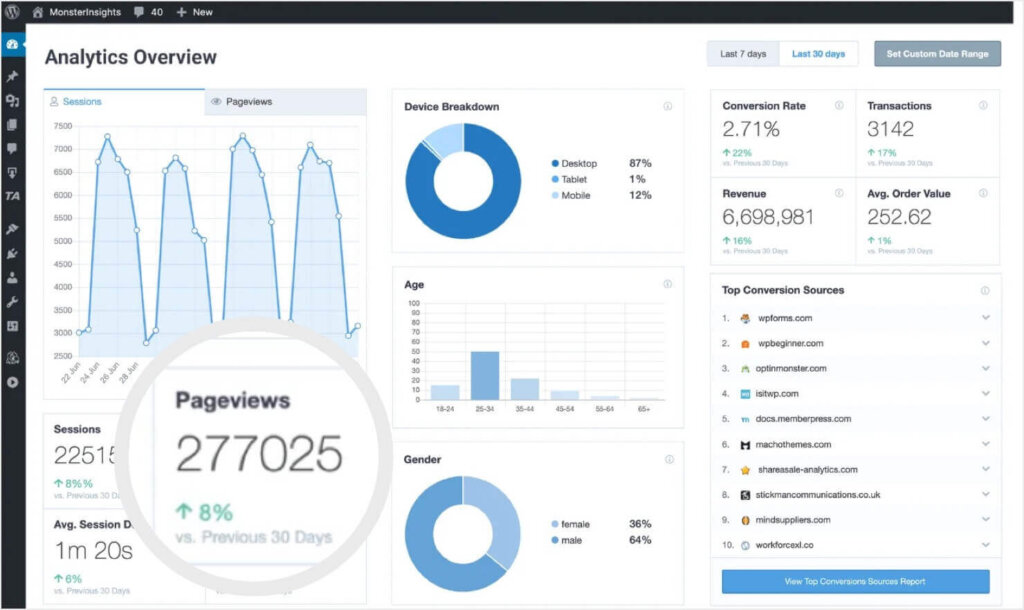
If you run a WordPress website, you can track page views and other vital analytics right in your WordPress dashboard. Simply sign up for MonsterInsights, install the plugin, and connect it to your Google Analytics account. Then, you’ll be able to see your page views right in the main overview report in your dashboard. No complicated GA4 reports required!
How to Improve Page Views:
There are 3 steps for increasing page views:
- Focus on SEO (search engine optimization) to drive more organic traffic to your site.
- Add helpful internal links to encourage visitors to view more pages.
- Use popups and floating bars to suggest related content and products.
Here’s an example of an OptinMonster popup to encourage visitors to continue browsing your site:

2. Bounce Rate
Bounce rate is the percentage of visitors who view one of your pages and then leave your site without taking any action. In other words, they don’t click any links, fill out any forms, or make any purchases.
How to Track Bounce Rate:
Bounce rate is easy to monitor in MonsterInsights. Just like pageviews, this website metric is included in the main overview report.
If you’re running reports or explorations in GA4, you can choose “Bounce rate” as a metric for monitoring your entire site or specific pages.
How to Improve Bounce Rate:
Looking for the #1 way to reduce your bounce rate quickly? Use exit popups. An exit popup lets you make one last offer to visitors before they exit your website.
OptinMonster’s Exit-Intent® Technology detects when a visitor is about to leave your site, based on mouse movement or mobile scrolling. You can set up an Exit-Intent® trigger in just a few clicks in our display rules:

Exit popup gives you an extra chance to keep a visitor engaged on your site.
3. Unique Visitors
Unique visitors are the number of distinct individuals who visit your website over a specified period, regardless of how many times they visit. This metric gives you your actual audience size and helps you gauge the reach and effectiveness of your marketing efforts.
How to Track Unique Visitors:
In GA4, the unique visitors metric is called “Total Users.” You can add this metric to an Exploration, or you can find it under Reports > Engagement > Events. There, you’ll see a table that includes a Total Users column.
How to Improve Unique Visitors:
If you want more people to visit your site, you’ll need to reach them through search, social media, or paid ads. Here’s an example of a Google Ad that’s targeted to people searching for bridesmaid dresses:

Ads like this one can reach potential customers who might not otherwise find your site.
4. Mobile vs. Desktop Visitors
This site metric shows you which devices people used to visit your site, whether desktop, tablet, or mobile phone. Knowing your users’ devices helps you better optimize the user experience (UX) for your visitors. If nothing else, it will illustrate the importance of having mobile-friendly websites. After all, the majority of overall website traffic now comes from mobile devices.

The mobile vs. desktop share can vary widely by website, so always keep an eye on this metric.
How to Track Device Traffic:
MonsterInsights makes it a breeze to always know your current device breakdown:
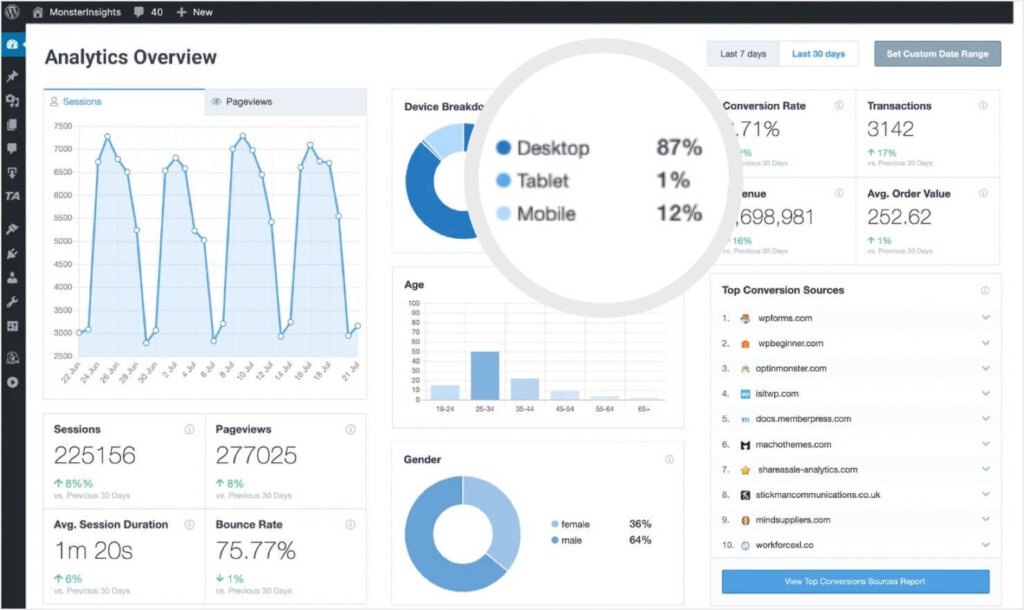
How to Leverage Your Device Traffic: Your mobile vs. desktop traffic isn’t something you need to improve or change. However, this data helps you make better decisions for your onsite marketing. All of OptinMonster’s 700+ templates are responsive across devices, but we also offer ones that are optimized specifically for mobile:

You can then use our Device-Based Targeting to show campaigns that are optimized for each user’s device.
5. Traffic Sources
How did people get to your website? Are they coming from social media, organic search, email marketing, direct visits, PPC ads, or affiliate links? When you understand your traffic sources, you can identify which channels are most effective in driving visitors to your site.
For example, if organic search is pulling in over half your traffic, that’s a good indication that your SEO is performing well. But if you only get a handful of visitors from your email marketing newsletter, then you should work on improving the quality of your email list and optimizing your email campaigns.
Your traffic source data does more than just show you what you can improve. It also helps you better understand your audience and how they are learning about your brand.
How to Track Traffic Sources:
In GA4, go to Reports>Acquisition to get data on how your visitors are finding your site.
However, you can get even more precise data by using UTM parameters. These custom URLs allow you to track your traffic from specific social media posts, paid ads, email campaigns, and more. If you haven’t used them before, check out MonsterInsight’s beginner’s guide to UTM parameters.
How to Leverage Your Traffic Sources:
Once you know where your traffic is coming from, you can optimize your site to nurture those visitors through your sales funnel.
With OptinMonster’s Referrer Targeting, you can target your popups, floating bars, and other onsite campaigns based on where your visitor came from.
Advanced marketers can target campaigns even more precisely using Query Argument Targeting. This rule lets you show targeted campaigns to people who’ve clicked on specific PPC ads, email campaigns, or social media posts.
6. Top Pages
Top pages are the most visited pages on your website. They often include your homepage, pricing page, most popular blog posts, or most popular product pages. It’s important to know which pages visitors are viewing the most, so you can focus more attention on optimizing those pages.
How to Track Top Pages:
In MonsterInsights, simply click Insights>Reports and then scroll down until you see your list of Top Posts/Pages.
For any analytics metrics you want to track in MonsterInsights, you can adjust the date range for your report:
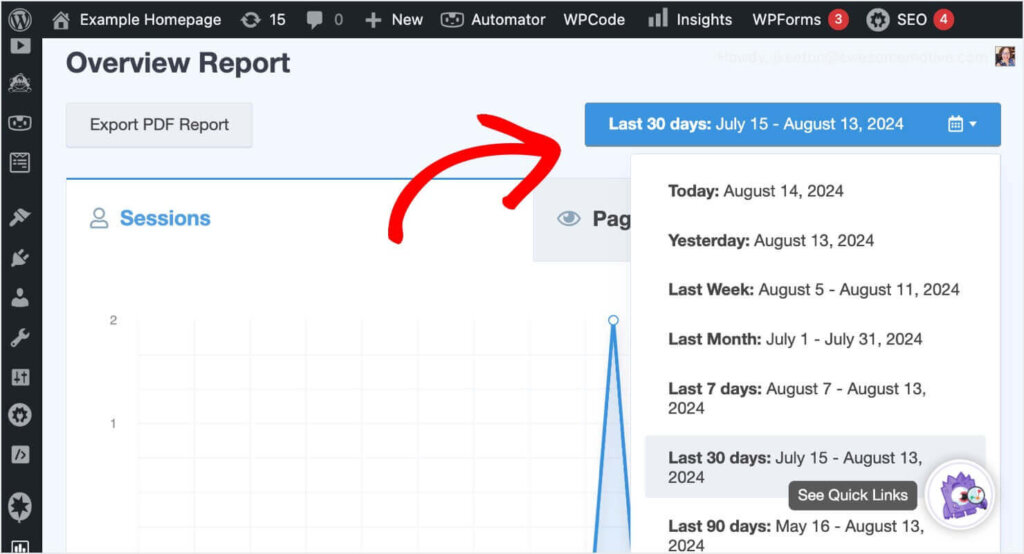
For example, you might have launched some new PPC campaigns 2 months ago. By adjusting the date ranges of your report, you can compare your top pages in the 2 months before and after those campaigns went live.
How to Optimize Your Top Pages:
Once you identify your top pages, you can focusing on improving them:
- Optimize for conversions: Add clear calls-to-action (CTAs) to your top pages to convert more visitors.
- Update content regularly: Keep your top pages fresh with updated content, images, and information to maintain high engagement.
- Add email signups: Turn those visitors into email subscribers, so you can continue marketing to them.
Collect More Emails With OptinMonster Popups
Check out our article: 25 Email Popup Examples (& Best Practices) to Explode Your List
7. Top Landing Pages
In terms of web analytics, “landing page” refers to the page where a visitor first arrives on your site.
For example, a user might search “how to grow daisies” and click your blog post on that subject in their search results. That visitor might go on to click other links on your site, but your blog post on growing daisies would be their landing page.
How to Track Top Landing Pages:
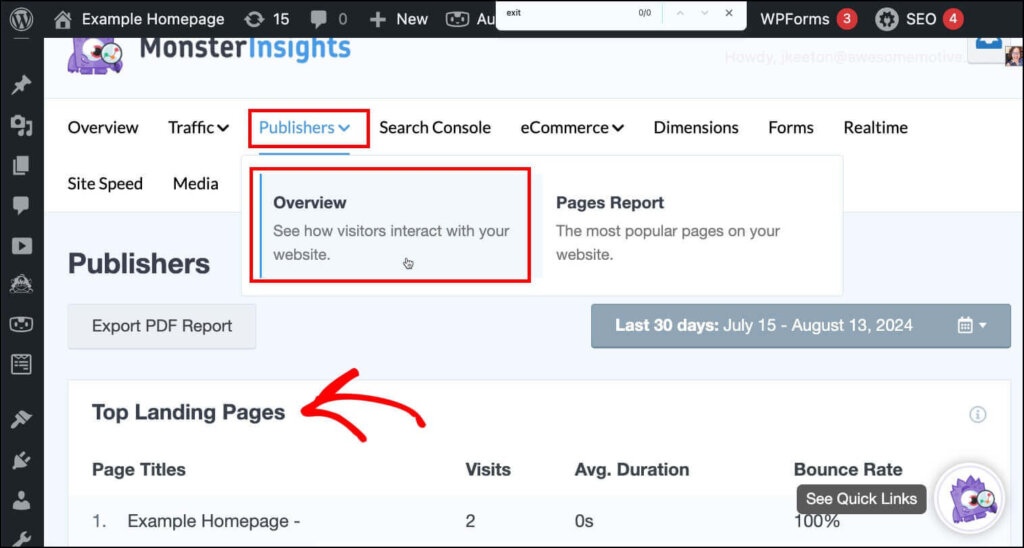
In MonsterInsights, click Insights>Reports>Publishers>Overview to see the list of your Top Landing Pages:
How to Optimize Top Landing Pages:
Your landing pages are your visitors’ first impression of your brand, so make sure these pages look great and include high-quality, relevant content.
You also need to encourage visitors to keep browsing your site by adding internal links to other helpful pages. You should also include your best CTAs, such as email signups, lead magnets, and “buy now” buttons. Remember to include links and CTAs above the fold, so you can catch visitors’ attention right away.
8. Top Exit Pages
Exit Pages are the specific pages where visitors most frequently leave your site. This metric helps you identify potential issues or barriers that might be causing visitors to leave.
Here’s an example: Let’s say you have a 3-page checkout process, and your website visitors are frequently leaving from the 2nd page of that process. This data lets you know that you may need to simplify and improve your checkout process.
How to Track Exit Pages:
Like the Top Landing Pages, you can find the Top Exit Pages within the Publishers report in MonsterInsights.
How to Reduce Exits:
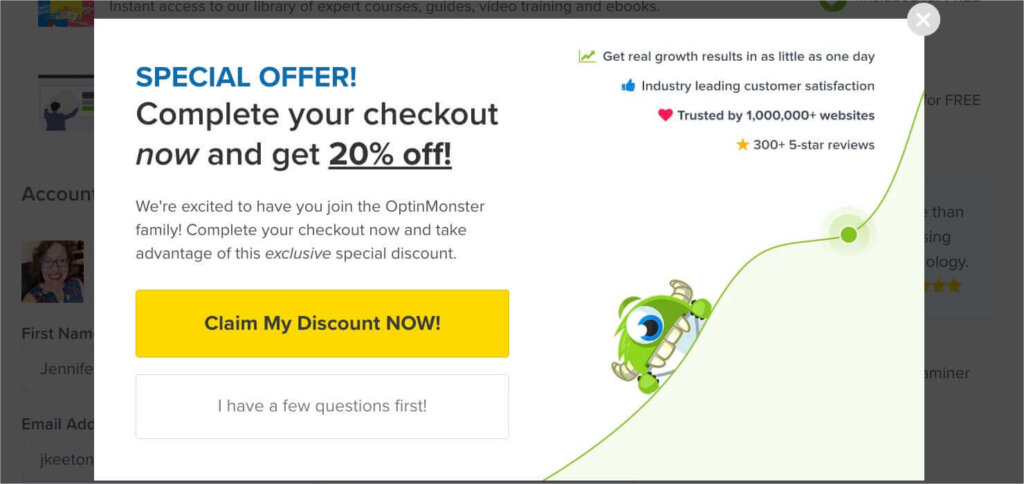
Once you know the pages visitors tend to exit from, you can stop them in their tracks with an Exit-Intent® popup from OptinMonster. Here’s an example of an exit popup we’ve used on our own checkout page:
And the gaming server provider Shockbyte used this OptinMonster exit popup to offer a discount code:

Do these popups work? Yes. In fact, Shockbyte attributes 52% of its sales to its OptinMonster campaigns.
Read the full Shockbyte case study.
9. New Visitors
A New Visitor is someone who is visiting your website for the first time. Tracking new visitors helps you understand the reach of your marketing efforts and how well you’re attracting fresh traffic to your site. If your number of new visitors goes down, then you can start experimenting with your marketing to make sure you’re reaching your target audience.
How to Track New Visitors:
Your New vs. Returning Visitors website metric in in the Overview Report in MonsterInsights.
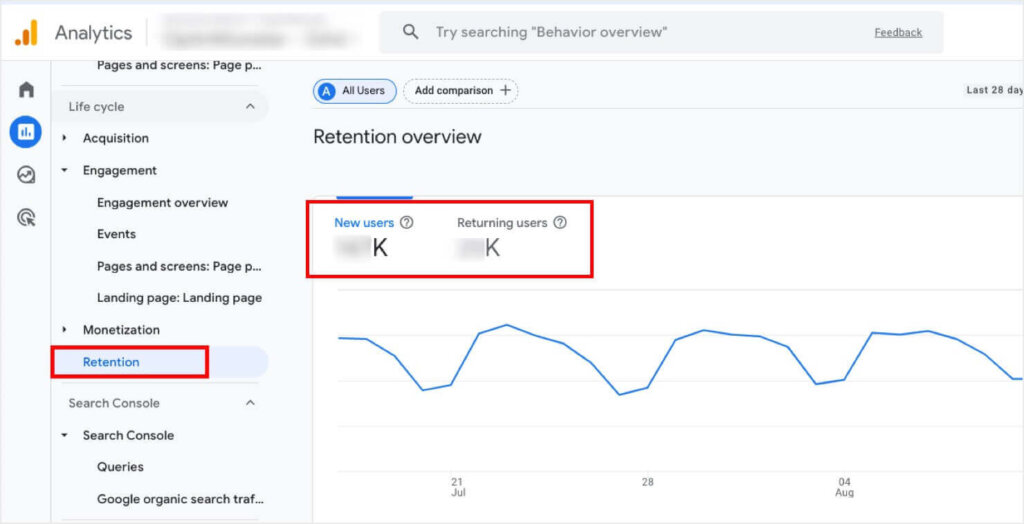
You can also find these numbers in Google Analytics by clicking Reports>Retention:
How to Increase New Visitors:
To maximize the number of new visitors to your site, consider these strategies:
- Focus on keyword research: Improve your search rankings by finding the right SEO keywords to target.
- Ramp up your content marketing: Create and publish high-quality, valuable content that interests your target audience. Blog posts, videos, and infographics can attract new visitors.
- Leverage social media: Promote your content across social media platforms to reach a wider audience. Engaging posts and targeted social media ads can drive new users to your website.
- Run Paid Campaigns: Use PPC advertising, such as Google Ads, to target specific keywords and demographics that are likely to bring new visitors to your site.
Impress New Visitors With a Welcome Message
Welcome Messages for Websites: 11 Examples to Improve Conversions & UX
10. Returning Visitors
A Returning Visitor is someone who has visited your website before and has come back for more. By visiting your site again, these leads have shown a higher level of interest and engagement with your brand. Returning visitors are more likely to convert into customers since they are already familiar with your site and liked it enough to come back.
A high rate of returning visitors also indicates that you’re doing a good job of engaging your new visitors.
How to Track Returning Visitors:
Your returning visitor site metric is displayed alongside your new visitors, so you can follow the same steps as above.
How to Convert More Returning Visitors:
Use OptinMonster’s OnSite Retargeting® to show targeted campaigns to your returning visitors. Here’s a video explaining how it works:
Here’s an example: You might show a new visitor a popup that offers a 10% discount in exchange for signing up for your email list.
But what if they don’t take you up on that offer?
The next time they visit, you can use OnSite Retargeting® to show them a different campaign that offers 20% off. That just might be enough to land the sale.
11. Page Load Times
Your page load time is the amount of time it takes for a page on your website to fully load in a user’s browser. Users expect fast-loading websites, and slow load times can lead to higher bounce rates and lower user satisfaction. Plus, page speed is one of Google’s top SEO ranking factors.
Speed is a vital performance metric for your website. Without fast load times, all of your other efforts will likely be in vain.
How to Track Website Speed:
MonsterInsights offers a Site Speed Report that lets you easily monitor your load times.
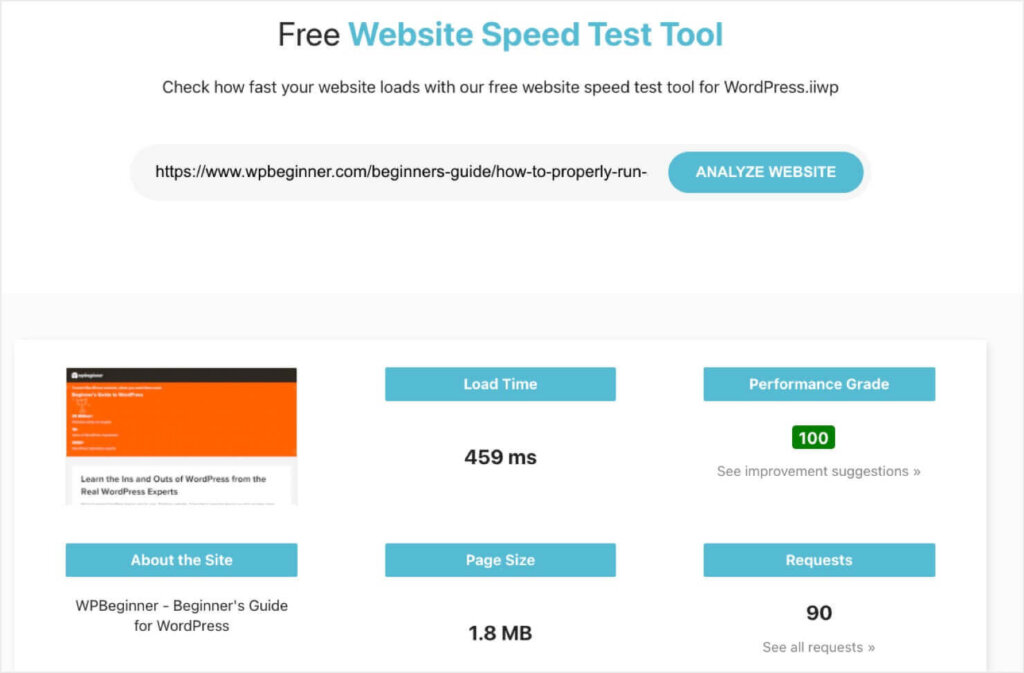
There are also a variety of free tools that let you test the speed of any webpage. For instance, you can enter any URL into IsItWP’s speed test tool and get a speed report:
How to Improve Page Load Times:
Website speed has a lot of contributing factors, and many of them are quite technical. One easy way to speed up your website is to optimize all your images. That is, make sure they are the appropriate size and compress them using a tool like Tinify.
Want more page speed tips? Check out WPBeginner’s Ultimate Guide to Boost WordPress Speed & Performance
12. Average Time on Page
Average Time on Page measures the average amount of time visitors spend on a specific page of your website. This metric is a strong indicator of how engaging your content is and whether it meets visitors’ expectations.
How to Track Average Time on Page:
Google Analytics calls this metric “Average engagement time.” You can find it under Reports>Examine User Behavior>Pages and Screens.
How to Improve Average Time on Page:
Many of the tactics for reducing bounce rates and exits will also help keep users on a page for longer. Here are a few more tips:
- Create great content: Your content has to be good enough for visitors to want to stick around. Make sure each piece of content is engaging and valuable from the very beginning so users will want to keep scrolling.
- Use multimedia: Incorporate videos, images, and infographics to keep users interested for longer.
- Use exit popups: Create great offers that entice users to stay on the page.
Learn More About the Average Time on Page Metric
What Is Average Time on Page, Why It Matters, and How to Improve It
More Website Metrics to Consider
These web page metrics will give you a great start to fully understanding your site’s successes and challenges. As you continue to build your expertise, you can also start exploring even more analytics, such as:
- Pages per session
- Average session duration
- Conversion rates for specific forms and CTAs
- Revenue attribution
- Event tracking
- Cost-per-conversion
- and many more
The data you can find in GA4 is practically endless. Start with the basics and gradually start monitoring more performance metrics as you grow your business.
If you use a WordPress site, MonsterInsights is the easiest way to keep a close eye on all your site data. And you can view your reports right in your WordPress dashboard!
Get started with MonsterInsights today!
Start Converting More Visitors Today!
Once you have a solid grasp of your site performance metrics, you can focus on turning more of those visitors into subscribers and customers.
OptinMonster is the best lead-generation software on the market. It lets you create highly targeted onsite campaigns that will keep visitors on your site longer and capture more email addresses.

Storyly used OptinMonster popups like this one to grow their email list by 45%!
What kind of results could you get for your business?
Related Resources:






Add a Comment