These days, users enjoy a large variety of survey data visualization tools. It’s something that can come in handy to every business whether you’re sharing it with the company staff, customers, or just using it for your own data purposes.
But when deciding which one to choose, there are many factors to be considered: price, reputation, user-friendliness, and selection of templates and styles.
What Are Survey Data Visualization Tools?
Collecting data and taking surveys is the easy part, but displaying this data in an easy to read way used to require the help of a graphic designer. It was a job that would take days and weeks.
With visualization tools, you can create the same charts and graphs in just minutes, automatically. The goal of data visualization tools is for users to make decisions more effectively, based on chart results.
In this article, we’ll compare the top 5 survey data visualization tools so you can choose the one that’s right for you.
What to Look for When Choosing a Survey Data Visualization Tool
- Ease of use: It should be easy to use (and figure out how to use) for everyone, even complete beginners.
- Features: There should be a collection of built-in features so you can create unique, powerful survey charts for your website.
- Support: Support should be consistently accessible in case you run into a problem.
- Account management: Entering your account to manage your tools should be easy to do.
- Integrations: Your surveys should integrate with a variety of email service providers, payment gateways, and other tools you use for ease of sharing and simplifying the survey building process.
- Price: Your budget will make a difference in what survey data visualization tools are available to you.
Now that we’ve gone over the key essentials to look for when choosing a survey data visualization tool, let’s dive into the top 5!
1. WPForms
WPForms is a WordPress plugin so you must have a self-hosted WordPress site in order to use it.
We chose WPForms as our best top pick overall because it’s the leading data visualization tool for beginners. It’s easy to set up, there are a ton of resources to learn from, and it works with any WordPress site. Its goal is to make adding forms to your WordPress website as easy as possible, while still catering to users with more advanced needs.
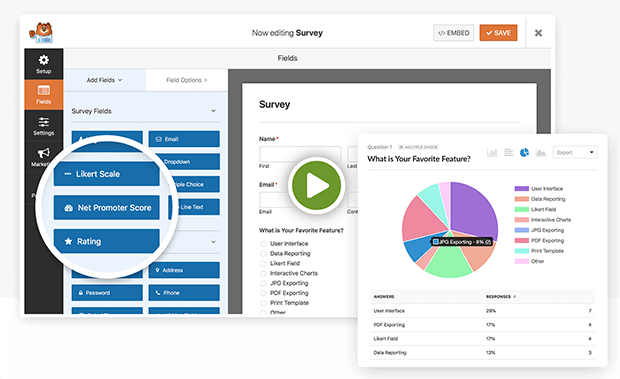
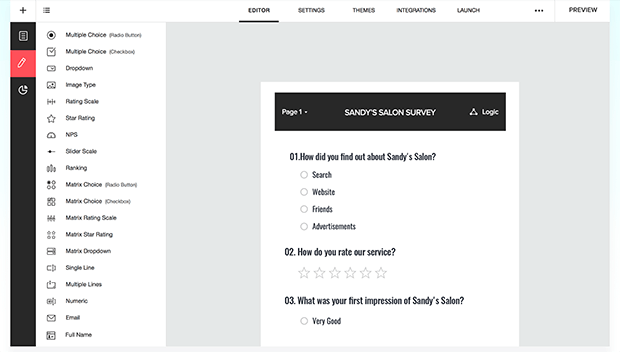
Building surveys in WordPress can be tricky, but WPForms offers a survey add-on that makes it easier. You can create an online survey or poll in just minutes. And, you don’t need to learn any code since everything is done through their drag and drop feature. You can integrate your surveys with your email marketing service of choice and you can even collect payments.
WPForms also offers an insights feature that automatically builds a stunning report with the best visualizations selected for each type of question. You can customize the reports, export graphs for your presentations, and share the results with your users.
WPForms integrates with PayPal and Stripe—two of the most popular and widely used payment processors. They also accept recurring Stripe payments, making donation collecting, subscriptions or membership payments painless.
The only downside to WPForms is that it can be used exclusively on self-hosted WordPress sites. Given that so much of the web runs on WordPress, this may not even be an issue for you.
Difficulty: Beginner-friendly
Cost: $199.50/year for the pro package which includes surveys and polls
Support: Excellent
Free trial: 14-day money-back guarantee; no free trial
Click here to sign up with WPForms.
2. Tableau
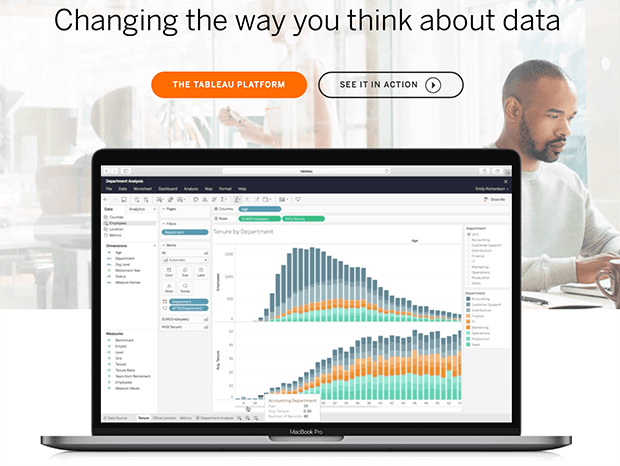
With over 1,000,000 user accounts, Tableau is a leader in data visualization. They’re popular for their visual data analysis.
Tableau users have easy access to analyze important data and can create sleek visualizations and reports. Like WPForms, Tableau also offers a drag and drop feature.
They’re often used by large companies but they also offer personal licenses.
Tableau offers 3 main products for data visualization:
- Desktop: Designed to connect and analyze disparate data, and create highly innovative reports in just a few clicks.
- Server: Allows users to securely collaborate, share critical insights, and information through dashboards created in Tableau Desktop or directly in the Tableau server.
- Online: This is a cloud-hosted version of Tableau Server. It saves money and time by skipping hardware setup and it also supports mobile access.
In addition to the tools above, Tableau offers a variety of other tools including Tableau Public, a completely free version of Tableau Desktop and Tableau Online for data intended to be shared publicly.
And, they recently came out with a new tool, Tableau Prep, intended for users to combine, clean, and prepare data more efficiently. Complex tasks such as joining and pivoting are easy to do with the drag and drop interface. Users can also edit values and reorder steps, seeing immediate results. Tableau Prep uses smart algorithms to combine repetitive tasks such as common spelling errors into a one-click fix.
It’s important to note that Tableau is not recommended for the beginner. WPForms is much more beginner-friendly. To get the most out of Tableau, you’ll need to go through their tutorial.
Difficulty: Intermediate
Cost: Free for Tableau Public, starts at $70/month for individuals
Support: Training, consultations, and support divided by product
Free trial: Yes, 14 days with Tableau Desktop
3. SurveyMonkey
As the name suggests, SurveyMonkey is a company that focuses exclusively on survey software. It’s a cloud-based tool that helps users create, send, and analyze surveys.
Survey templates are one of the best features of SurveyMonkey. There are so many to choose from and they’re professionally built and designed.
Each question in the templates has its own purpose and is important for the results. And, surveys are fully customizable by adding logos, corporate colors, and themes.
If you’re looking for more than just a survey tool, SurveyMonkey can integrate with analytics and CRM tools like Tableau and Salesforce. You can set up payments through Stripe, which offers automatic fraud protection.
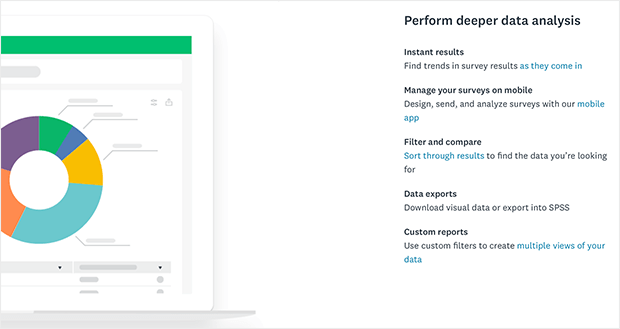
You can make an account on their website where you create and save forms, collect responses, and analyze results. You can also see the results in a dashboard you create, analyzing individual responses or surveys as a whole.
To help avoid data bias, SurveyMonkey uses question, page, block, and order randomization.
They also offer users multiple question types including matrix, video, rating, slider, star, A/B testing, and ranking questions.
The downside of SurveyMonkey is the support offered by each plan. It’s not the most beginner-friendly software and getting the support you need can depend on how much you pay. For example, if you’re on their first-tier paid plan, your emails will not be prioritized. And only if you invest in the most expensive plan will you get phone support.
Difficulty: Intermediate
Cost: $456/year individual, or $32/month/user for team advantage
Support: 24/7 email support, phone support
Free trial: Yes, 30 days
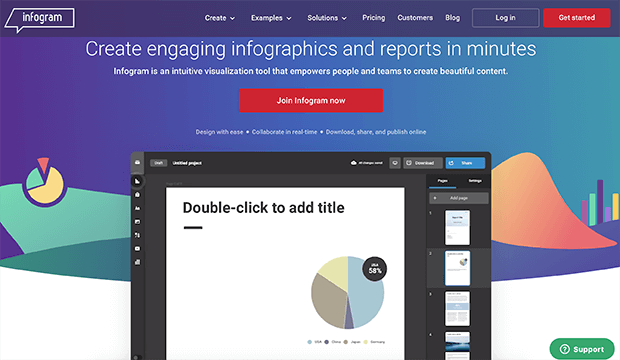
4. Infogram
Media companies, marketers, and strategic business leaders may be attracted to Infogram’s data visualization solution.
However, with Infogram, you can’t take surveys directly. You need to record your data elsewhere, then import it into Infogram. Only then can you choose how you want to visualize and present that data.
Like WPForms, Infogram uses a drag and drop editor, making it simple to edit colors and styles, add icons, and set display options to make your data shine.
Its comprehensive set of tools include over 500 maps, over 35 interactive charts, ready-made design templates, easy drag and drop editor, multiple images and icons, import and export data, interactive dashboards, interactive charts, interactive maps, and reports.
Infogram is one of the most reliable ways of creating fully responsive infographics that stun users across all devices.
They have a variety of plans including a free Basic Plan. The Basic Plan only offers the simplest of features like the importation of data, 35+ chart types, 2 map styles, and the publishing of content. But their paid plans expand beyond that.
Let’s take a look.
- Pro Plan: Includes everything from the basic plan plus 500+ map types, 1 million images and icons, privacy, premium themes, 100 library size, and more.
- Business Plan: Everything in the pro plan plus 1000 library size, your own logo, chart clickability, custom links, and analytics.
- Team Plan: Everything in the business plan plus team functionality, advanced training, and first priority support.
The downside to Infogram is that you can’t directly take surveys on their site, you have to import the data from another tool. You need to learn how to do this. As a result, if you don’t care too much about the visual aspect of your charts, the price might seem a bit high since Infogram is all about being visually appealing.
Difficulty: Beginner-friendly
Cost: Plans start at $29/month
Support: Online during business hours
Free trial: Yes
5. Zoho Survey
Zoho Survey lets you create surveys directly on the platform.
If you want more options than what the free tools provide, or you need to support a large number of responses, Zoho Survey is ideal.
If you’re familiar with building surveys, Zoho Survey is pretty straightforward to use. Some of the surveys they offer can get quite complex with lots of skipping and branching depending on the answers. Luckily, Zoho Survey handles this in an excellent way. And if you don’t have a ton of experience, they offer webinars and live online training to help you get started.
They have a free plan, which covers many great categories like social sharing, 10 questions/survey, 100 responses/survey, over 200 survey templates and more. So if you’re just looking for basic survey needs, this is a good option for you. If you’re wanting to expand, you can choose from one of their paid plans that offer a lot more in terms of the number of questions and responses you can have, plus more customization options.
With a paid plan, Zoho Survey can integrate with Zoho Sheet, Slack, Google Sheets, Tableau, Shopify, and Zendesk. They cover all the common question types: freeform, multiple choice with single and multiple answer options, sliding scale, Likert, net promoter, and more. You’ll always have the correct option available for the type of response you are looking for.
On the downside, Zoho Survey falls short with its limited branding options. Sometimes it can be difficult to get an exact match for your existing website design.
Difficulty: Some experience needed
Cost: Starting at $29/month/user
Support: Online during business hours
Free trial: No
Which Survey Data Visualization Platform Is Right For You?
Based on our analysis, WPForms is the best tool for most use cases. They’re the easiest to use compared to some of the more complex options. And you’re able to take survey data and create reports based on the results all within the same tool.
They’re also the lowest priced. Unless you need more complex interactive charts or infographics, WPForms is more than enough for most businesses, especially if your website is run on WordPress.
Of course, the decision always depends on your needs, experience, and what you value most: price, user-friendliness, and selection of templates and styles.
Do you have a survey data visualization platform that you use and love? We want to hear about it! And, if you want to get the most out of your surveys, check out our guide to survey best practices.




Add a Comment