OptinMonster makes it easy to integrate with Google Analytics. If you’ve integrated your OptinMonster campaign with Google Analytics, you can view detailed impression and conversion reports.
In this article, you’ll learn how to view OptinMonster campaign events in Google Analytics.
Before you start, this guide assumes you’ve already connected your campaign with Google Analytics.
It will take 48 hours for Google Analytics to process the initial data we send them. After that time, it takes up to 24 hours for Google Analytics to process campaign event data. If you need to check campaign data sooner we recommend using Google Analytics’ Realtime feature as shown in this guide.
In-house analytics data from OptinMonster can be viewed at any time following this guide.
Required: Custom Dimensions
Before you can run reports from your Google Analytics account, it is necessary to first create custom dimensions in Google Analytics for your GA4 Property.
To create custom dimensions for your OptinMonster campaigns in Google Analytics, follow these steps:
- Sign into your Google Analytics account.
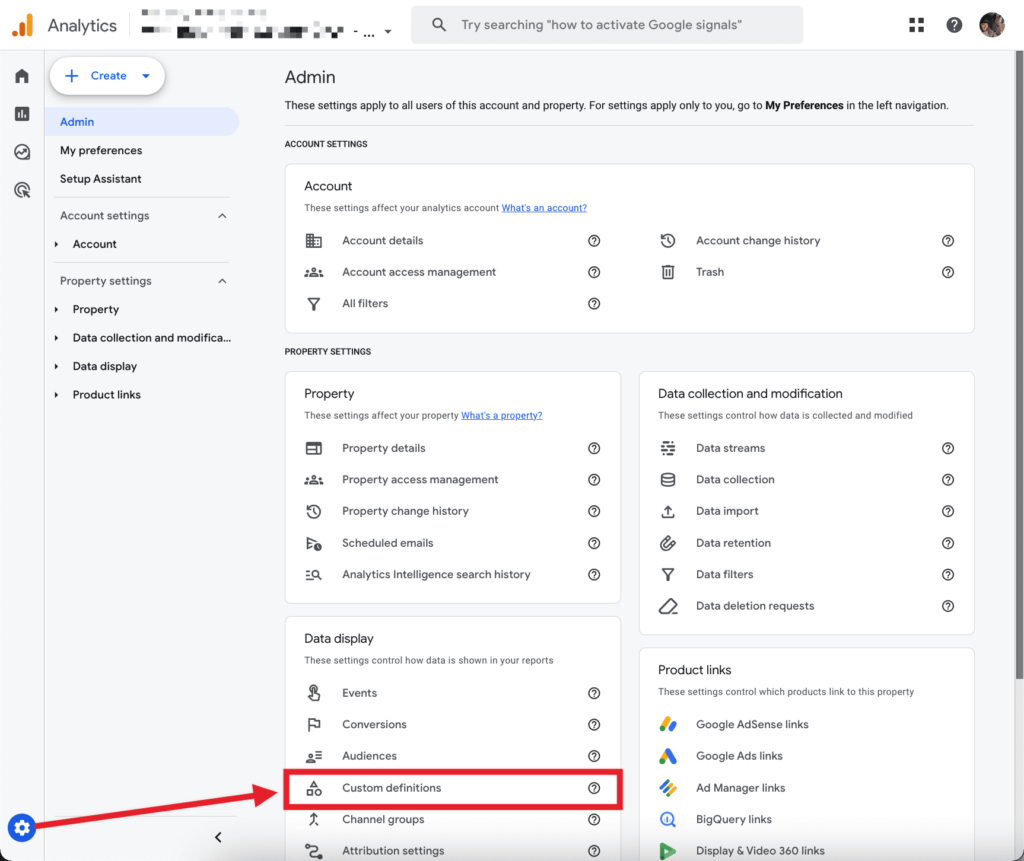
- While viewing the Google Analytics property you wish to modify, click the gear icon in the lower left-hand corner. Then select the Data display > Custom definitions option.
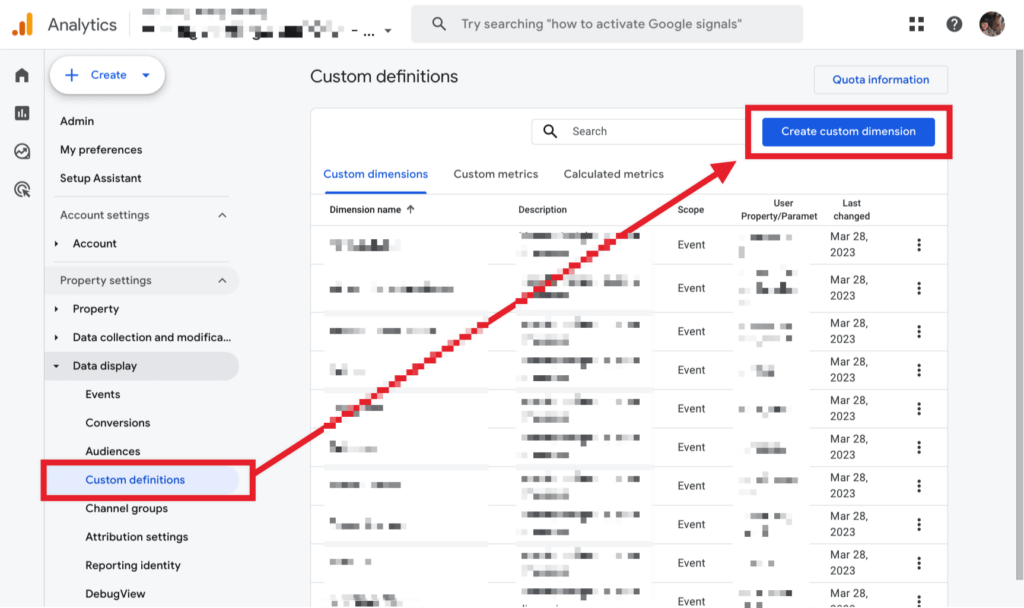
- In the Custom definitions screen, select the Create custom dimension button.
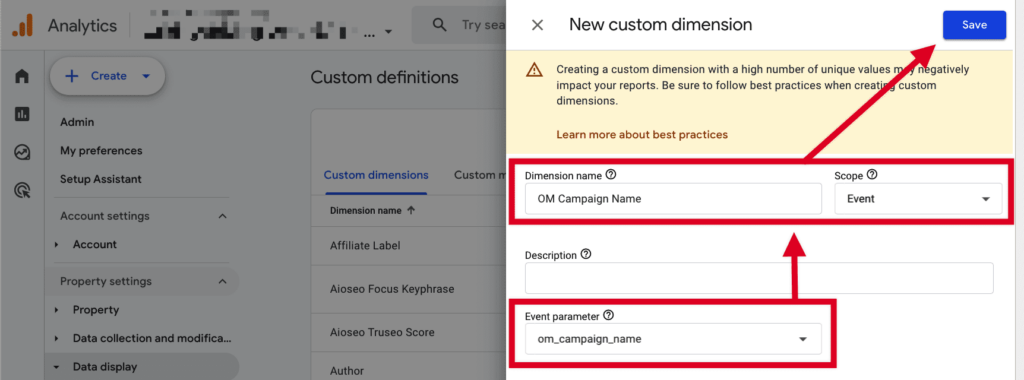
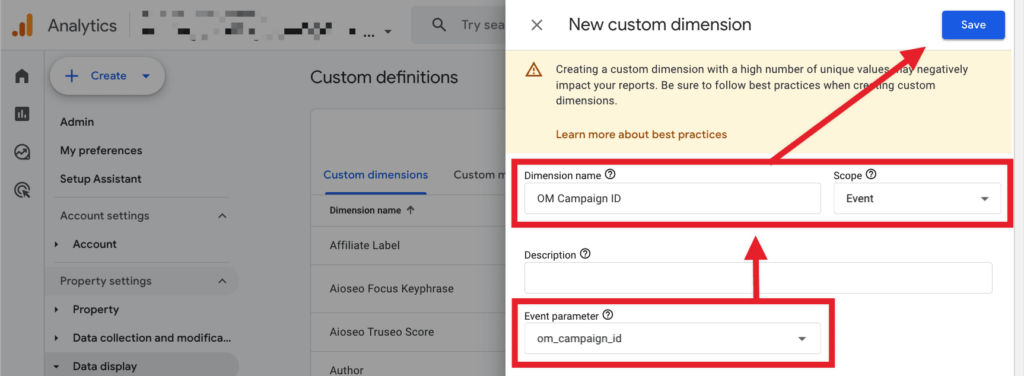
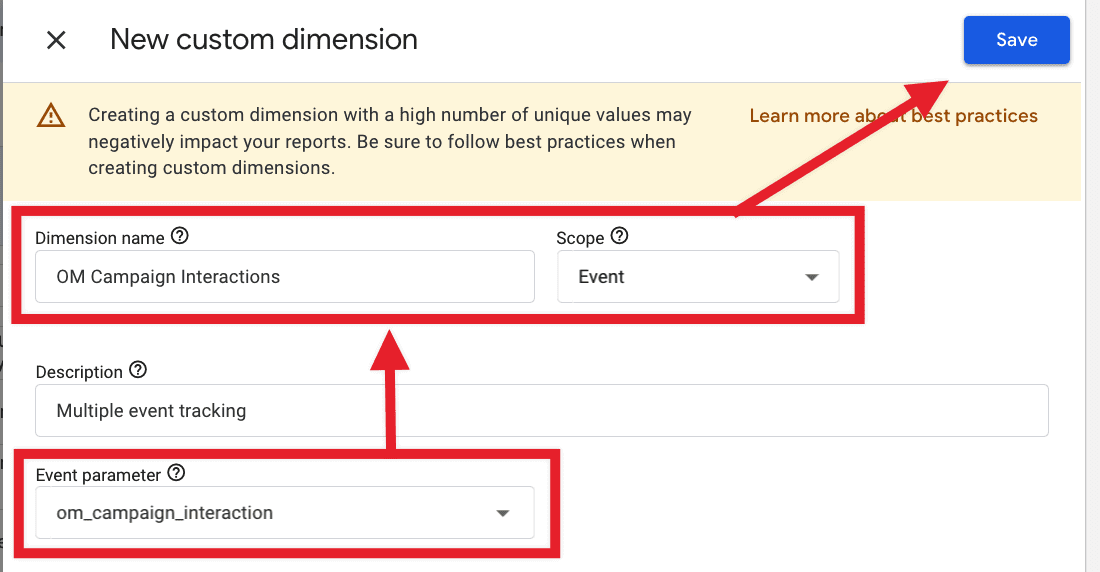
- You’ll create three new Custom Dimensions: OM Campaign Name, OM Campaign ID, and OM Campaign Interaction. For each, set the Scope to Event, and enter the associated Event parameter as
om_campaign_name,om_campaign_id, andom_campaign_interaction, respectively.
Learn more about using Custom Dimensions in Google Analytics
Realtime Reports
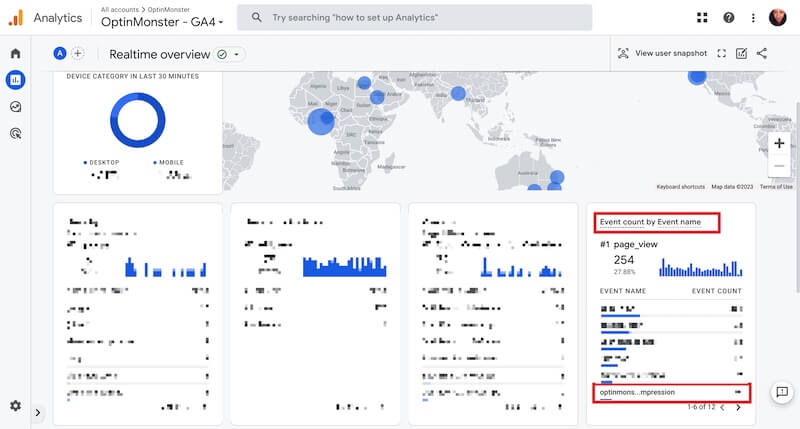
Using Google Analytics’ Realtime report, you can view campaign events that have taken place in the last 30 minutes following these steps:
- Be sure you are logged into your Google Analytics account.
- Open the Realtime report for the Google Analytics Property you’ve connected to your OptinMonster campaign.
- Optional: In a new tab/window, test your OptinMonster campaign following one of the options in this guide.
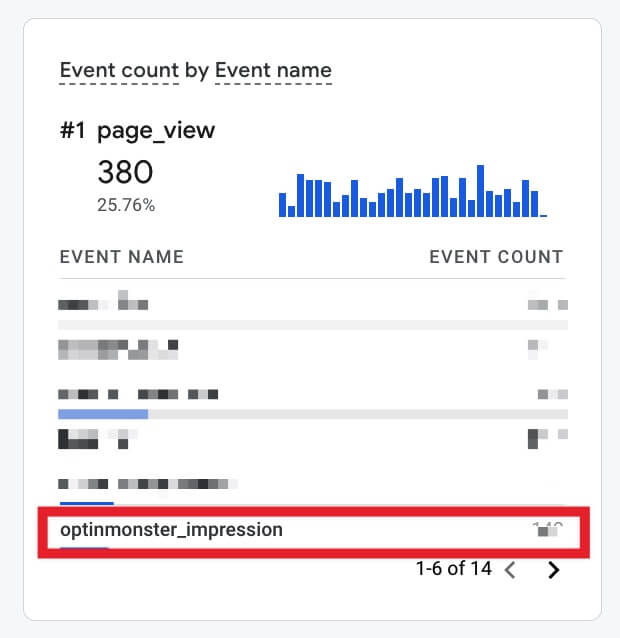
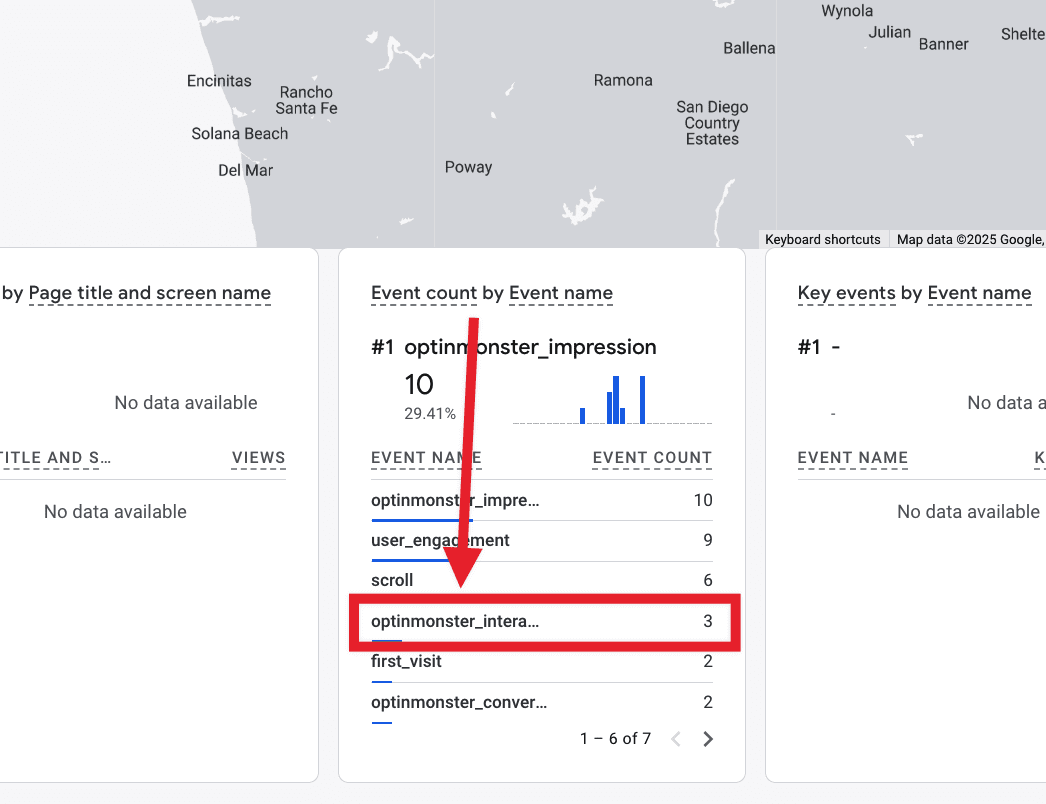
- Viewing the default report you can find the optinmonster_impression, optinmonster_conversion, and optinmonster_interaction data within the Event Count card.
Campaign Impressions and Conversions
To view specific impressions and campaigns in your Realtime report, follow these steps:
- Select optinmonster_impression or optinmonster_conversion from the Event Count card.
- optinmonster_impression: event tracked each time a campaign is displayed to a visitor.
- optinmonster_conversion: event tracked each time an element with conversion tracking enabled is activated by a visitor.
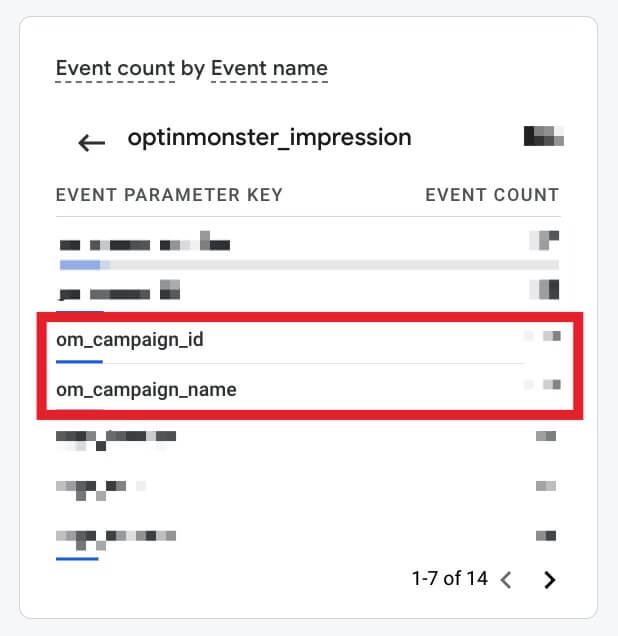
- Next, select om_campaign_id or om_campaign_name depending on how you’d like to identify your specific campaign in the Realtime report.
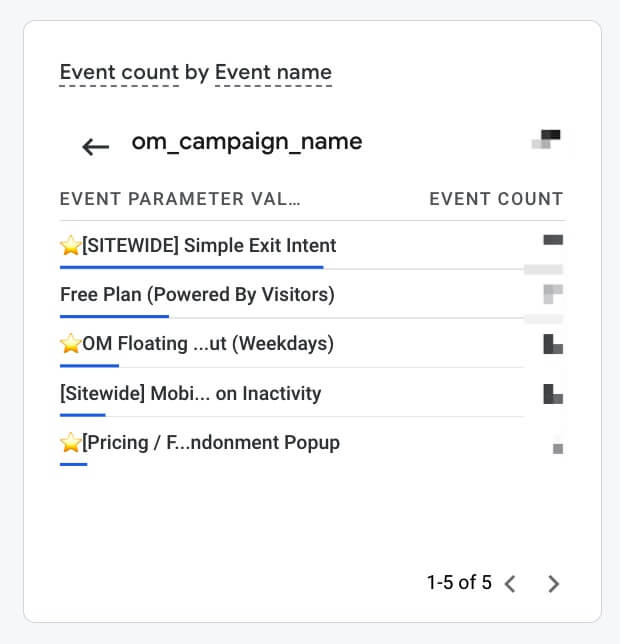
- In this example, we selected om_campaign_name and a list of campaigns is displayed. Here you can track the realtime reporting of event data for your specific campaign to test that it is working as you intend.
Campaign Interactions
To view specific interactions within your campaigns, follow these steps:
- Select optinmonster_interaction from the Event count card.
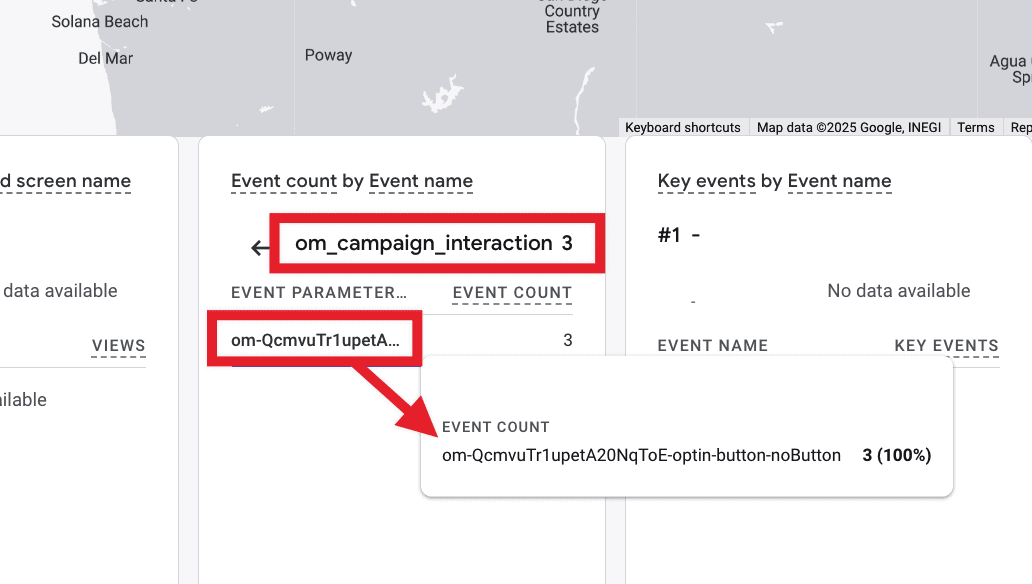
- Next, you can further filter the data in the Event count card by selecting om_campaign_name, om_campaign_id, or om_campaign_interaction.
- om_campaign_name: will show a list of campaign names and the event count for their campaign interactions.
- om_campaign_id: will show a list of campaign IDs and the event count for their campaign interactions.
- om_campaign_interaction: will show a list of GA Block IDs and the event count for their element interactions.
Event Reports
Important:
It takes 48 hours for Google Analytics to process the initial data we send them, so Event Reports will not reflect your OptinMonster campaign data until then. If you need to access data earlier than 48 hours please use GA’s Realtime reports.
In GA4 we can access OptinMonster Event Data by navigating to the Reports > Engagement > Events view. In the Events table, you’ll find the optinmonster_impression, optinmonster_conversion, and optinmonster_interaction events listed:

Selecting a specific OptinMonster event will allow you to further filter the associated data:

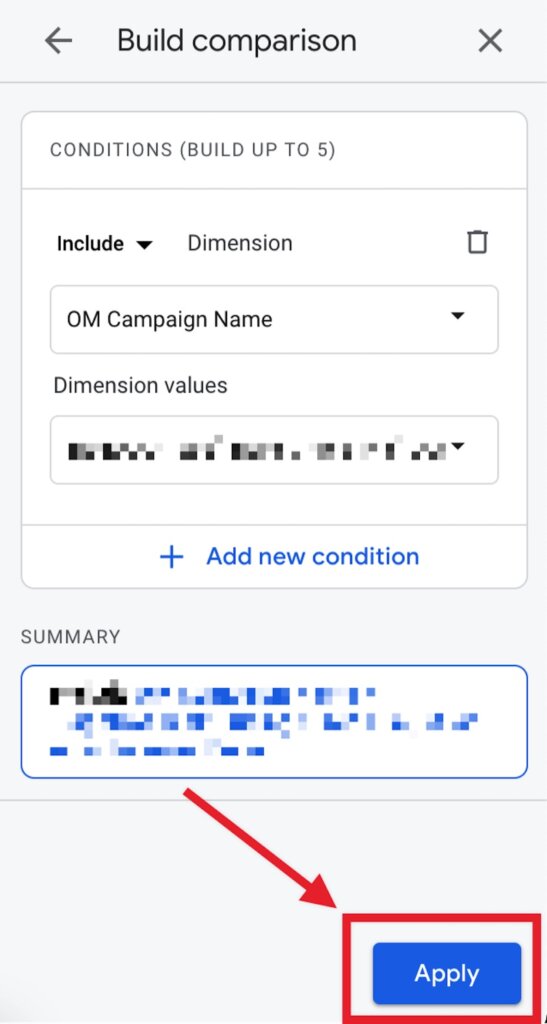
From this same screen, or returning to the previous screen, you can run more advanced reports by building a Comparison and selecting an individual OptinMonster campaign.
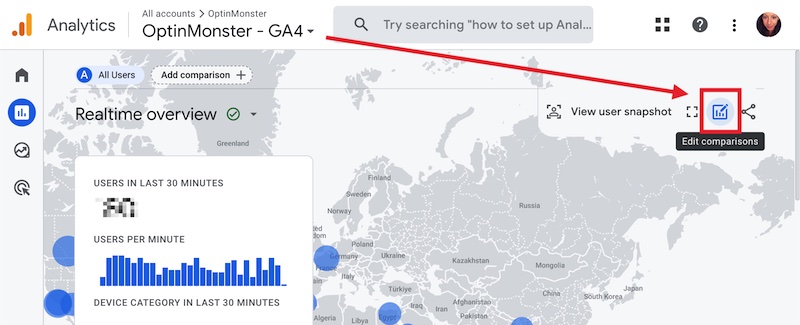
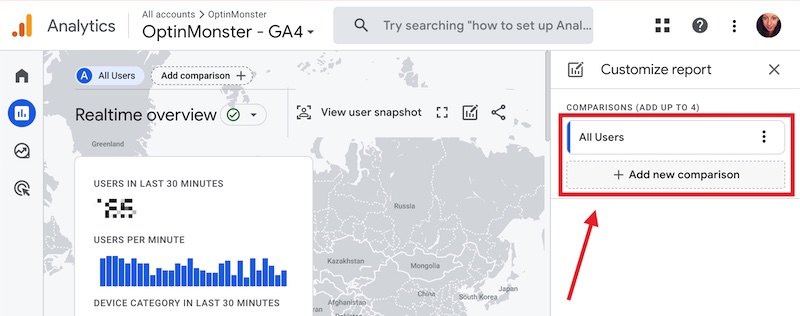
- To do this, first select the Edit comparisons icon.
- In the right panel, select an existing Comparison or add a new one to start.
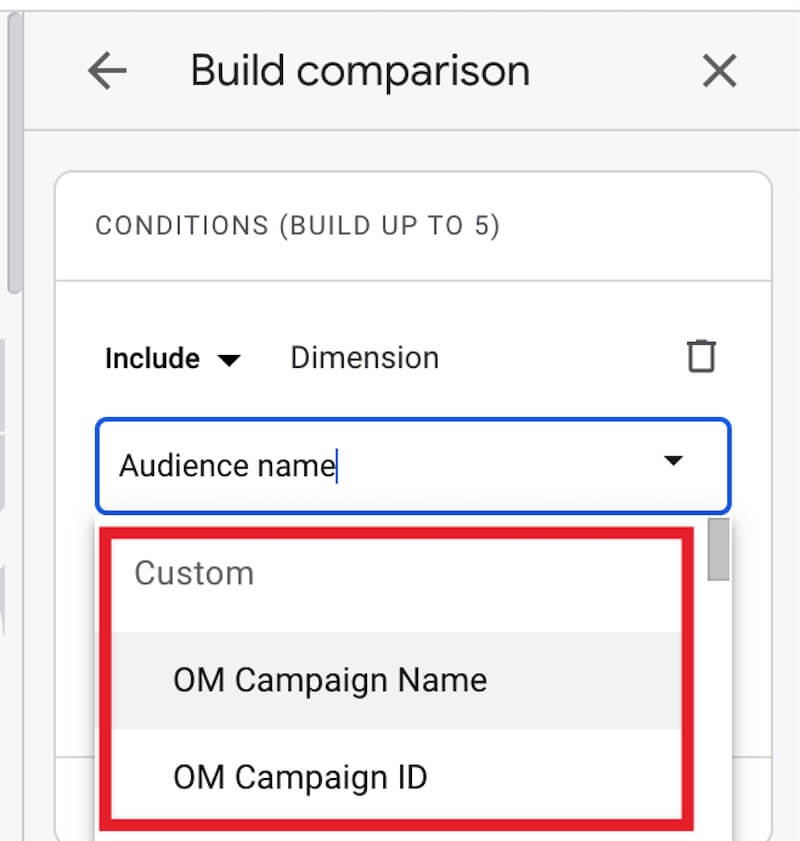
- From the first dropdown field select Campaign Name from the Custom Events section.
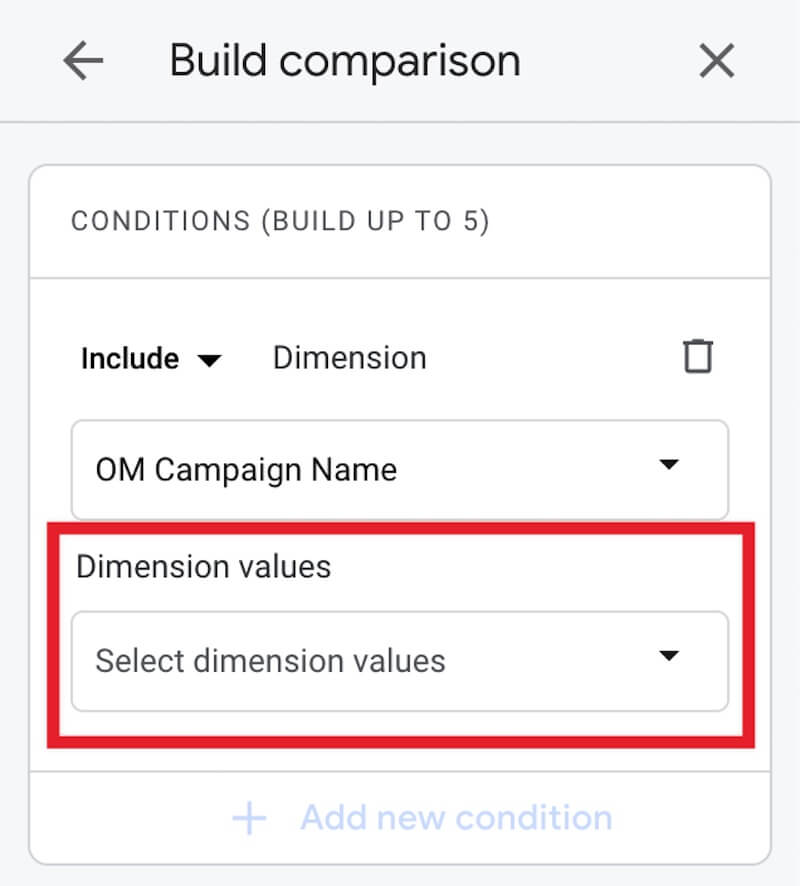
- Next, select the specific OptinMonster campaign you are testing from the Dimension values dropdown.
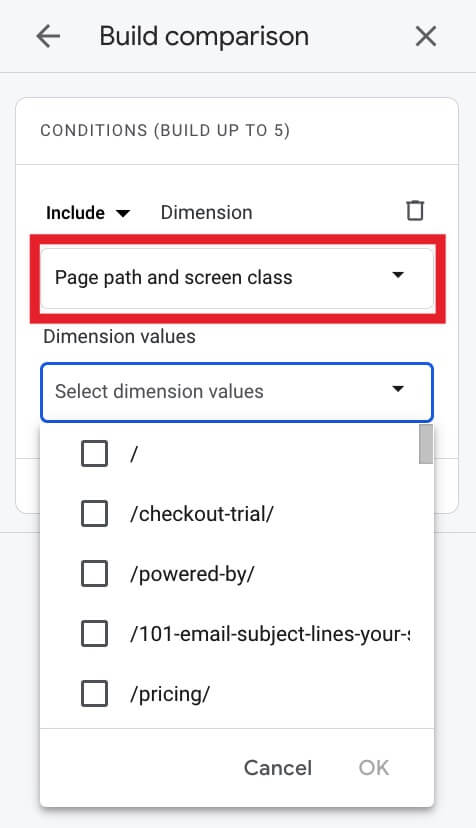
- Optional: Add any other conditions to your Comparison you would like to use when filtering campaign event data in your Realtime report.
For example, view data specific to an individual Page by selecting Page path and screen class then select the individual page(s) you want to use in the Comparison: - Select the Apply button to finish building your Comparison.
- Your Event report will now show data only for the OptinMonster campaign you’ve indicated in the Comparison.
Learn more about creating custom reports in GA4
FAQs
Why do I see different impression counts in OptinMonster and GA4?
That’s a great question, and it’s very common to see different impression/conversion numbers in your OptinMonster dashboard compared to what you see in Google Analytics 4 (GA4). This is completely normal, and it doesn’t mean anything is broken!
The difference comes down to how each system tracks and records a campaign view.
Think of an OptinMonster Impression as the most direct and accurate count. Every single time we display one of your campaigns to a visitor, our own system immediately and reliably counts it.
A GA4 Impression, on the other hand, is only recorded when OptinMonster successfully tells Google Analytics that a campaign was shown, and the Google Analytics tracking script on your site successfully hears and records it.
Here’s a breakdown of the core differences.
- Tracking Method:
- OptinMonster: We track impressions directly through our own system and send the data straight to our servers. It’s a closed loop.
- GA4: It relies on its own separate tracking system being loaded and running correctly in your visitor’s web browser.
- Data Reliability:
- OptinMonster: Our native tracking works independently. It isn’t affected by most other scripts or browser extensions on the page.
- GA4: Its ability to count an impression depends entirely on its tracking code being properly loaded and initialized on your site, without being blocked.
- Counting Logic:
- OptinMonster: We count every single time a campaign is displayed. No exceptions, no estimates.
- GA4: On sites with a lot of traffic, GA4 may use a process called sampling, where it counts a percentage of impressions and then estimates the total number.
- Processing Requirements:
- OptinMonster: Our count happens instantly when the campaign is displayed.
- GA4: For the count to happen, the GA4 script must not be blocked by the visitor’s ad blocker or other privacy browser extensions, which is very common.
Why are my GA4 impression/conversion numbers consistently lower than in OptinMonster?
As we covered in the previous question, OptinMonster and GA4 are not the same thing. It is very common to see lower numbers in GA4. This doesn’t mean anything is broken! It’s usually due to one of these common scenarios:
- Many visitors use ad blockers which often stop Google Analytics from running. In this case, OptinMonster still counts the impression, but Google Analytics never receives the message.
- If a visitor’s internet is slow or there’s another script on your page that causes an error, the Google Analytics tracking code might not load properly. Again, we’ll count the impression, but GA4 won’t.
- Some visitors have browser settings that block all Google Analytics tracking for privacy reasons.
- On websites with very high traffic, Google Analytics might use sampling. This means it doesn’t record every single event but instead estimates the total based on a smaller sample. OptinMonster, on the other hand, always counts every impression.
Which impression/conversion metric should I trust for reporting?
You should trust OptinMonster’s native analytics for the most accurate count of how many times your campaigns were actually displayed or converted. Think of our numbers as the true display count. GA4 data is still very valuable for seeing how those campaign interactions fit in with all the other behaviors on your site, like page views and goal completions.
How does OptinMonster track impressions in GA4?
When a campaign is displayed to a visitor, OptinMonster sends a custom event to GA4 called optinmonster_impression. This event also includes the campaign’s name and ID, which is why we had you set up those custom dimensions earlier! This allows you to filter and view data for specific campaigns right inside of Google Analytics.
Why might I see impression spikes in OptinMonster but not in GA4?
This usually comes down to timing and traffic volume. OptinMonster counts every single impression in real-time. During a big traffic spike, GA4 might use sampling (where it only counts a percentage of impressions and estimates the rest) or experience processing delays. So, you’ll always see the most immediate and complete data inside your OptinMonster dashboard.
Can I send events to Google Analytics when using a Custom HTML form in my campaign?
Yes, to do this you will need to modify your form’s code to track conversions when the form is submitted.
Learn how to track conversions with your custom HTML form
What data does OptinMonster send to Google Analytics?
OptinMonster sends the following data to GA4 Properties:
- Custom Event:
optinmonster_impression - Custom Event:
optinmonster_conversion - Custom Event:
optinmonster_interaction
For each Custom Event, we pass the following data as custom event parameters:
- Campaign Name (
om_campaign_name) - Campaign ID (
om_campaign_id) - Campaign Interaction (
om_campaign_interaction)
It’s possible that Google Analytics may also track other data with this that we don’t control. However, the above details are all that OptinMonster sends to Google Analytics.

