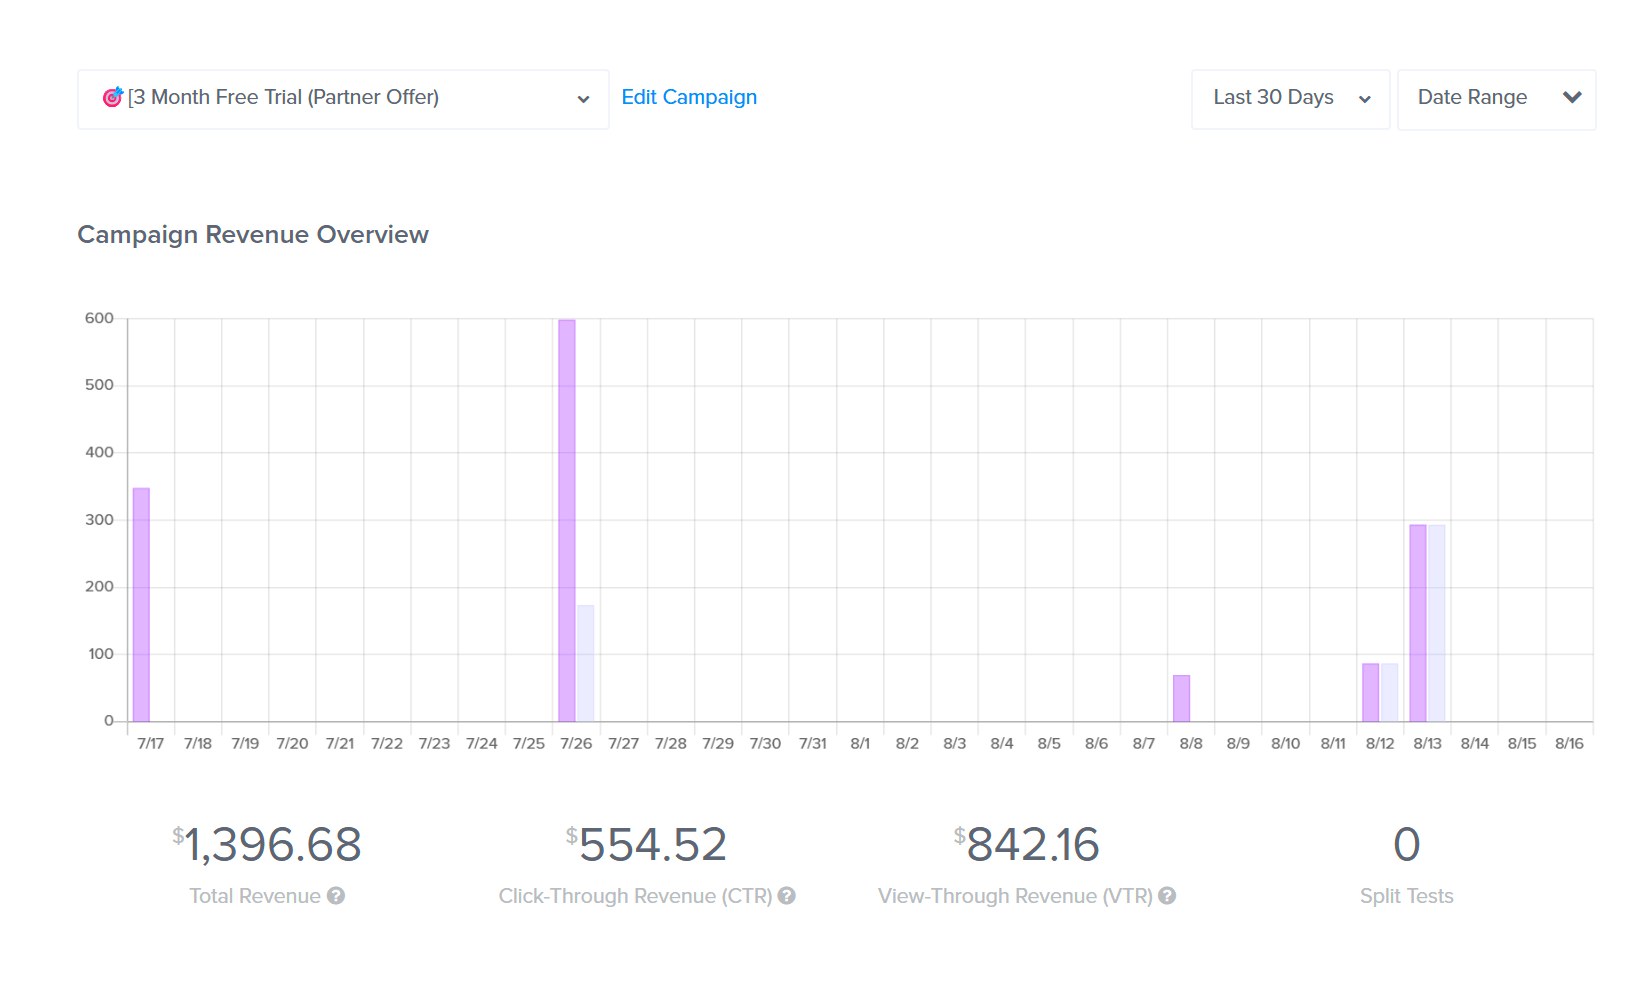
OptinMonster’s native Analytics provide valuable insights into the performance of your campaigns. By using the tracking, reporting, and filtering options available, you can get a complete picture of how your campaigns are performing and make informed decisions to improve their effectiveness.
In this article, you’ll learn how to view OptinMonster campaign events in native Analytics.
Before You Start
Here are some things to know before you begin:
- This article assumes you’ve already created a campaign in your OptinMonster account.
- This article assumes you’ve enabled conversion tracking on your campaign.
- Note that all data is updated periodically and may not reflect real-time changes.
Analytics Data on the Campaigns Screen
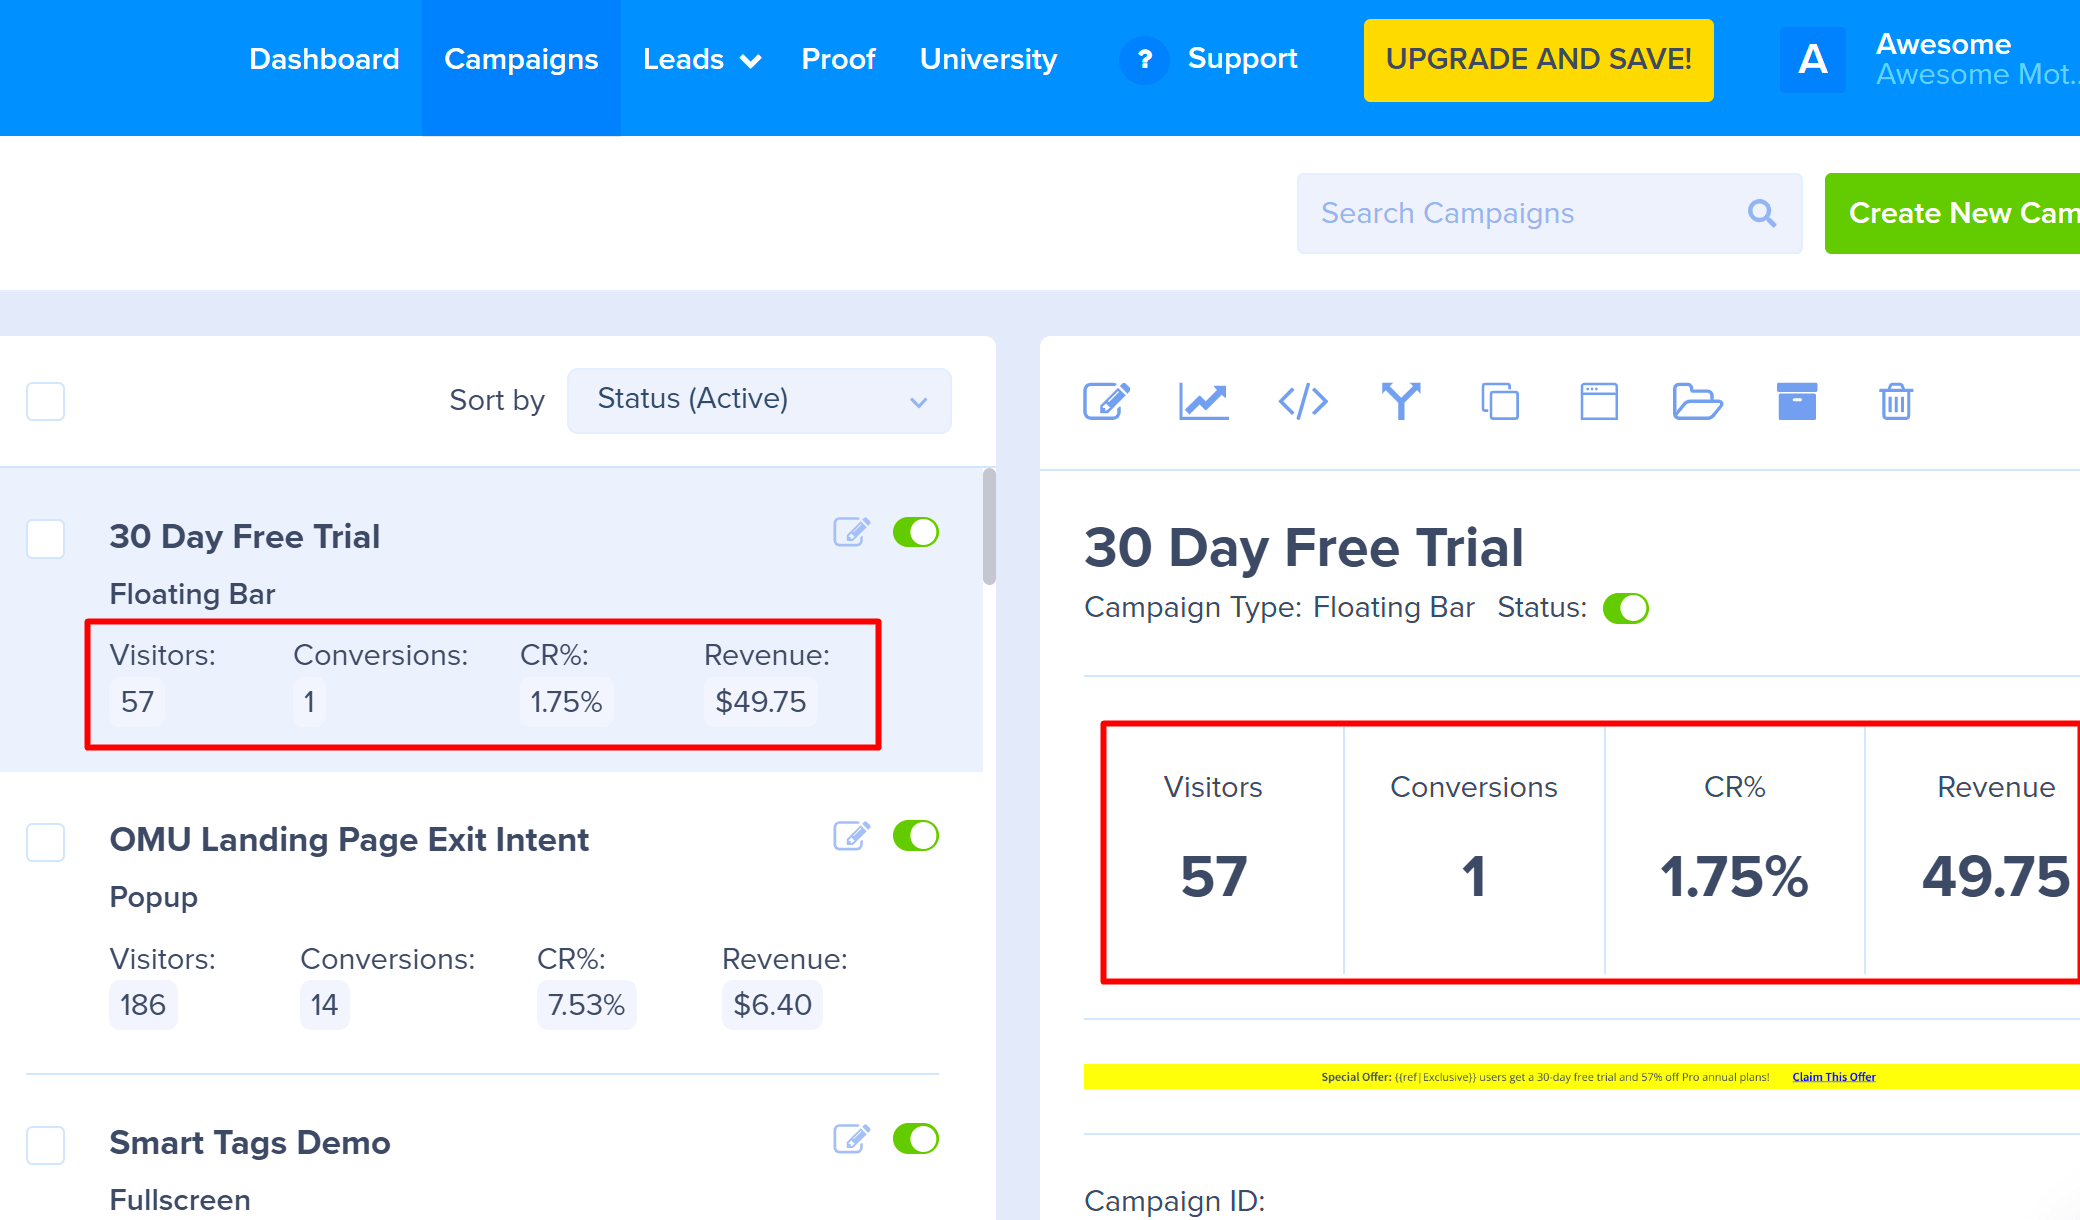
When you first log in and go to your Campaigns dashboard, you’ll see a list of all the campaigns you’ve created. This screen gives you a quick, at-a-glance look at how each one has been doing over the last 30 days.
Here’s a quick rundown of what each column means:
- Visitors (Impressions): The total number of times your campaign was displayed to visitors.
- Conversions: The number of times visitors completed a desired action, such as submitting their email address through the campaign or clicking a button that redirects them to a specific URL.
- CR% (Conversion Rate): The percentage of visitors who converted, calculated by dividing the number of conversions by the total impressions/visitors.
- Revenue: If Revenue Attribution is enabled, this column shows the total revenue generated by the campaign.
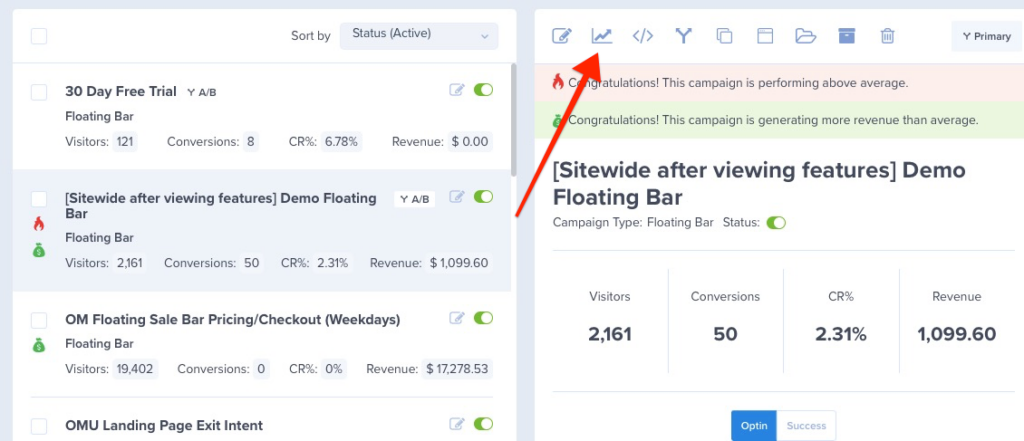
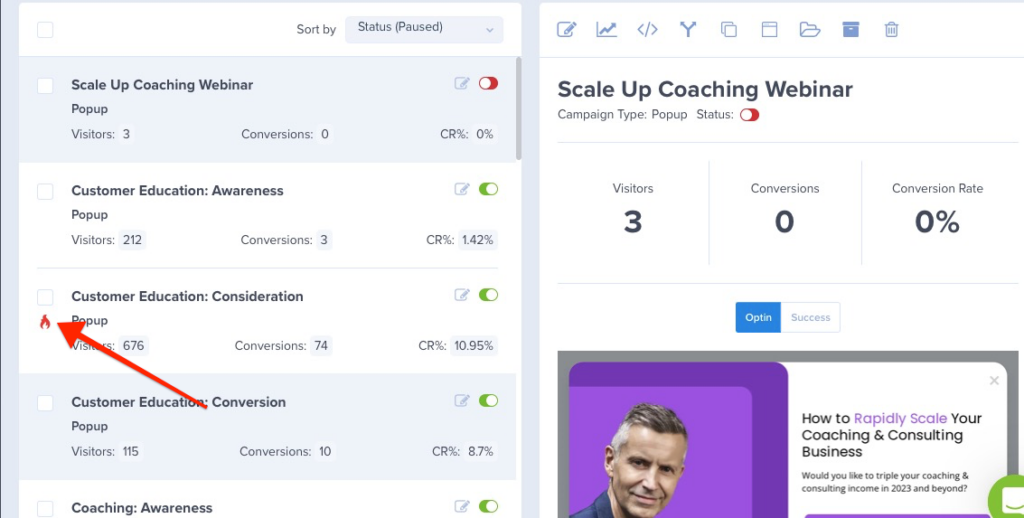
You might also see a little on fire icon next to some campaigns. This is our way of highlighting campaigns that are performing exceptionally well! It appears when a campaign has a great conversion rate and has reached at least 100 visitors or 20 conversions. It’s a fun sign that you’re on the right track!
Specific Campaign Report
When you create a campaign in OptinMonster that you intend to track the detailed performance of, the campaign will be integrated with our native Analytics by default.
To view campaign event details in OptinMonster’s Analytics, follow these steps:
- Login to your OptinMonster account.
- Once logged in, select the campaign of your choice.
- Click the ‘Analytics’ button for your campaign to open that particular campaign’s Analytics report.
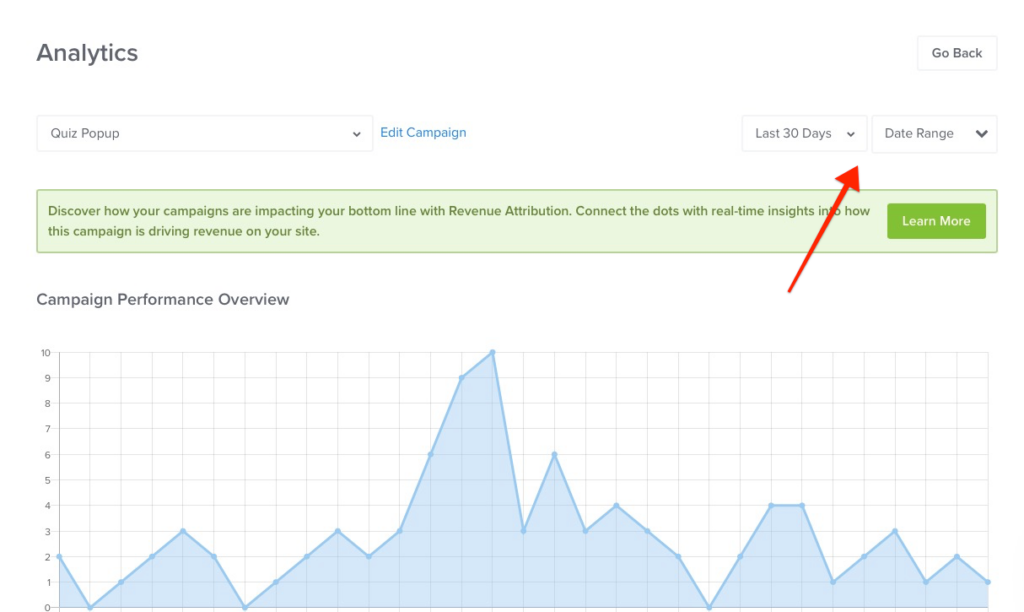
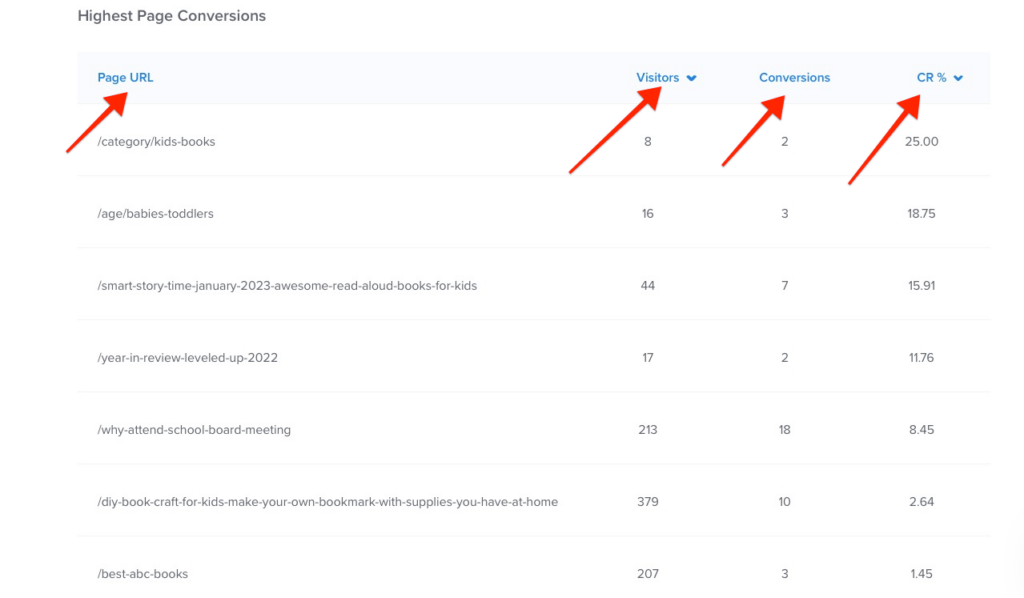
- Data on the Analytics page can be filtered by date using some preset options or picking a specific date range. You can also sort the Highest Page Conversions by the number of Visitors or Conversion Rate %.
Note: If you have Revenue Attribution enabled on your account, you’ll also see a graph showing your Revenue Attribution metrics for the time period you’ve selected. This is a super helpful way to see the direct financial impact of your campaign!
Account Dashboard Reports
The Account Dashboard provides an overview of your campaign’s performance, including key metrics such as impressions, conversions, and conversion rates. You can view the overall performance for your campaigns or filter by date range to see performance over time.
Select the Dashboard link from the top menu of the OptinMonster App:
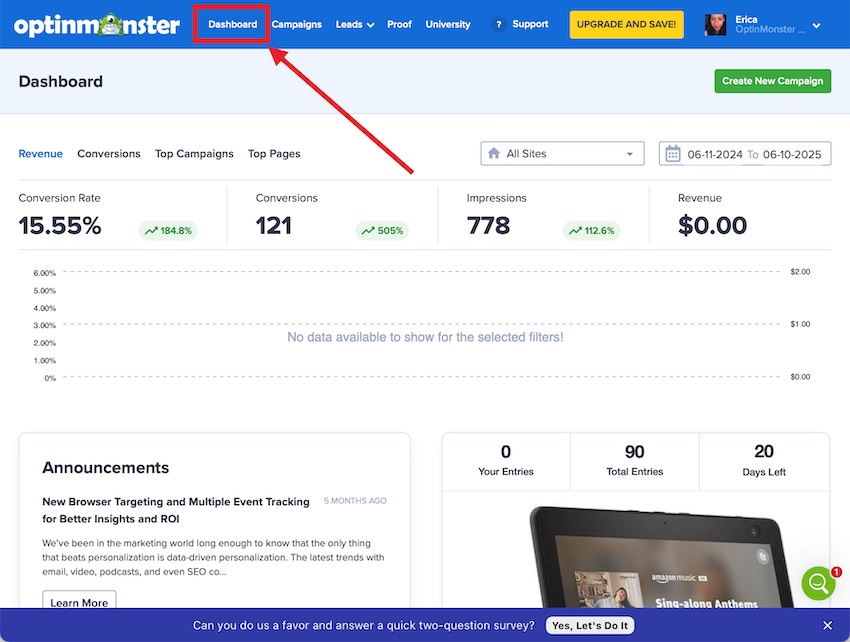
Choose from Revenue*, Conversions, Top Campaigns, or Top Pages reports. You can also filter the reports by site and date range.
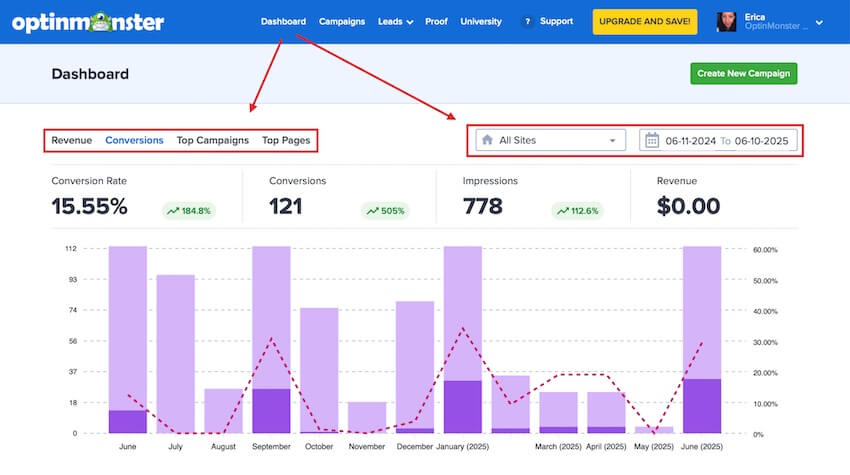
*If Revenue Attribution is enabled for your account
FAQs
How can I run more details Analytics reports for my OptinMonster campaigns?
You can connect your campaigns to Google Analytics and run more advanced Analytics reports directly from your Google Analytics account.
Learn how to connect OptinMonster with Google Analytics
What’s a reasonable average conversion rate?
An excellent average conversion rate depends on various factors, including industry, target audience, and campaign type. Typically, a 1-3% conversion rate is considered good, but this can vary significantly based on your specific circumstances.
What causes the on-fire icon to appear?
The on fire icon appears when an OptinMonster campaign performs above average AND has at least 100 impressions or 20 conversions. This icon is displayed in the Campaigns screen to indicate a campaign performing exceptionally well.
What is the earliest date the analytics can be filtered to?
The earliest filter date is the date the campaign was created. This means you cannot filter data before the campaign was created in your OptinMonster account.
How do I track conversions while using an embed form block?
Follow our guide for tracking conversions using an embed form block.

