
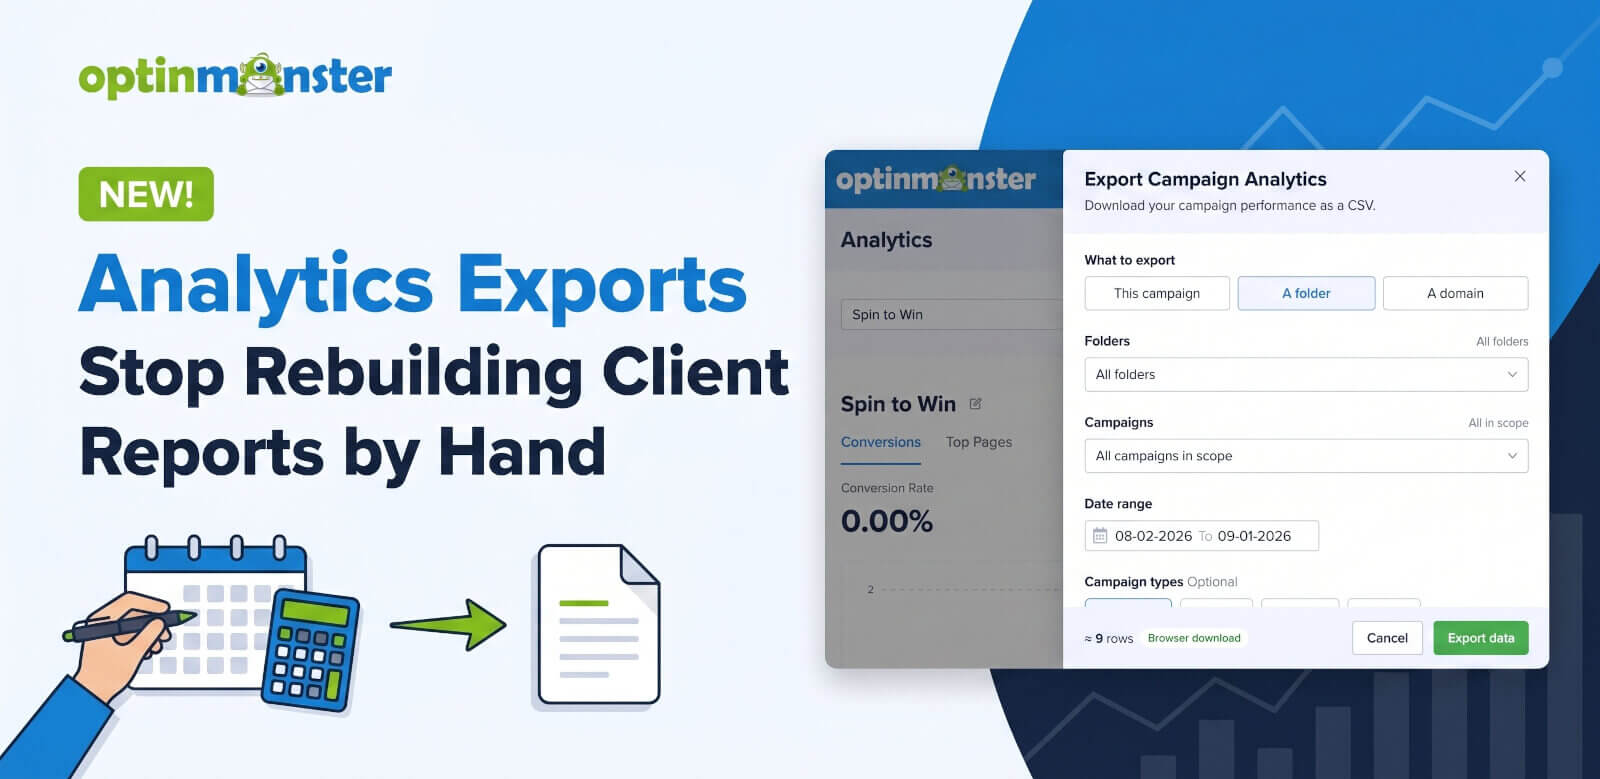
Are you tired of rebuilding client reports by hand, every single month?
We’ve heard this from marketing agencies a lot, and the frustrating part is that the data already exists. It’s just been stuck inside your OptinMonster dashboard.
So every month, you copy campaign numbers into a spreadsheet, one analytics screen at a time. Then you do it again for the next campaign, and the next client, because each client needs their report cut differently.
That changes now.
We’re launching Analytics Exports, available now on Pro and Growth plans. It pulls your campaign data out of the dashboard and into a filtered CSV, with exactly the scope, date range, and columns you choose.
The screen-by-screen copying is gone. Just export the data once, then build the report your client actually asked for.
What is Analytics Exports?
Analytics Exports pulls your campaign performance data out of OptinMonster and into a CSV file. This data opens in Excel, Google Sheets, Numbers, or whichever tool your reports already live in, so your numbers end up right where you work with them.
You can find the new Export Analytics button at the top of any campaign’s analytics screen. Just click it and the export panel slides in from the right side.

From here, you control what to export, how to filter it, and which columns to include. So the file you download comes ready for the report you’re building, with exactly the data you need.
Export the Exact Cut of Data You Need
An export isn’t a data dump. You’re in charge of every row.
Pick what to export, then keep narrowing until the file holds exactly what you need.
Setting the date range also takes just one click. Pick a preset like Last 7 Days, Last 30 Days, or Last Month, or set a custom range on the calendar to fit your needs.
Only want the popup numbers? Limit the export to specific campaign types and pull just your Popups, or just your Floating Bars, Slide-ins, Fullscreen, or Inline campaigns.
It’s an easy way to keep a report focused on the campaigns that your client cares about most.
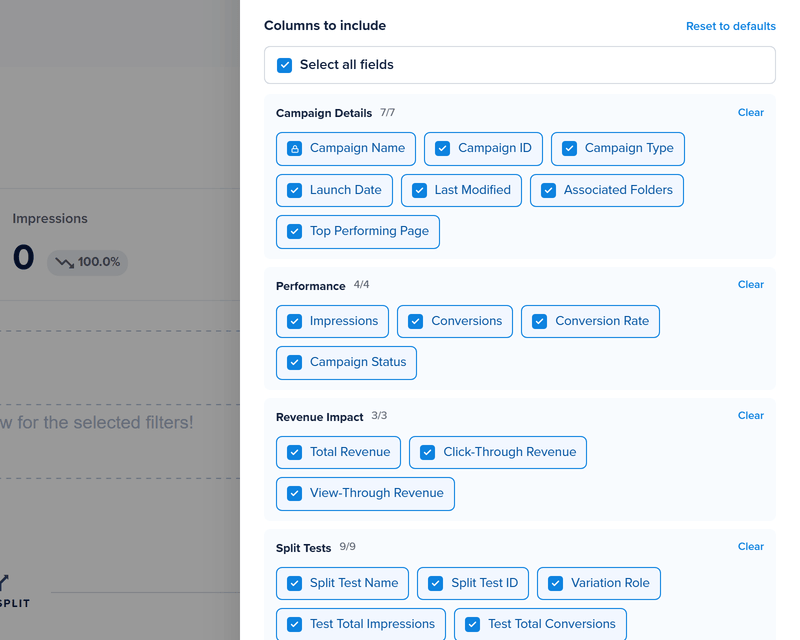
Which columns you include is up to you, too. The Columns to include picker sorts them into four groups, and you can toggle each column on its own:
- Campaign Details: the campaign’s name, ID, type, launch date, last modified date, associated folders, and top performing pages
- Performance: impressions, conversions, conversion rate, and campaign status
- Revenue Impact: total revenue, click-through revenue (from visitors who converted in the campaign before buying), and view-through revenue (from visitors who saw it, then bought)
- Split Tests: the test’s name and status, each variation’s totals, and which variation is the Primary
Every export includes the Campaign Name column, and as you adjust your filters, the estimated row count updates live at the bottom of the panel. So you know exactly what you’re getting before you click anything.
Built for Multi-Client Work
If you run campaigns for more than one client, or more than one website, this is the part we built for you. Client reporting is where you prove your work is paying off, and scope is what makes it fast.
At the top of the panel, under What to export, you’ll choose your scope:
- This campaign – just the one you’re viewing
- A folder – every campaign in the folders you pick
- A domain – every campaign on the websites you pick
You can select more than one folder or domain, or narrow down to specific campaigns within them.

If you keep each client’s campaigns in their own folder, then that’s the whole client’s data in one download. One export per client, not one per campaign.
Now multiply that across every client you manage.
Split Tests, Revenue, and Top Pages in Every Export
Total numbers are only part of the answer for a report. Clients will typically have questions about which version of the campaign had better results, how much revenue it brought in, and which pages the conversions came from.
Analytics Exports puts all three answers in the file as columns.
Split tests come through in full. Each variation gets its own row, with its own impressions, conversions, and conversion rate, so the file shows which version of a campaign is doing well instead of one blended number.

The Revenue Attribution columns also cover the revenue question. Just turn them on, and every campaign will include its total, click-through, and view-through revenue, which is the number that clients ask about most.
The Top Performing Pages column answers the last question, which is where those conversions came from.
The file also records its own context. Its name includes the export date, and a short header records the date range, generation time, and account. So, anyone who opens that CSV weeks later knows exactly what they are looking at.
And if an export is too large for the browser, we’ll email you a download link instead, usually ready in 5 to 10 minutes and valid for 7 days.
3 Ways to Use Analytics Exports Right Now
1. Build Each Client’s Report From One Export
Set the scope to a client’s folder, pick your date range, and export. Everything that client’s campaigns did lands in one file, ready to shape into their report.
2. Put Campaign Revenue in Your Reports
If you have Revenue Attribution enabled, include the Revenue Impact columns, and the revenue each campaign generated goes straight into your presentation or report. Your client was going to ask for that number anyway.
3. Audit Every Campaign on a Website in One File
Set the scope to a domain and export everything. Then, sort by conversion rate to see which campaigns are performing well and which need attention.
Also Featuring: The Analytics Screen Redesign
Analytics Exports ships alongside a redesigned campaign analytics screen.
A new filter bar separates your campaign selector and date range controls from the charts below, so the controls for what you’re seeing sit in one clear place.
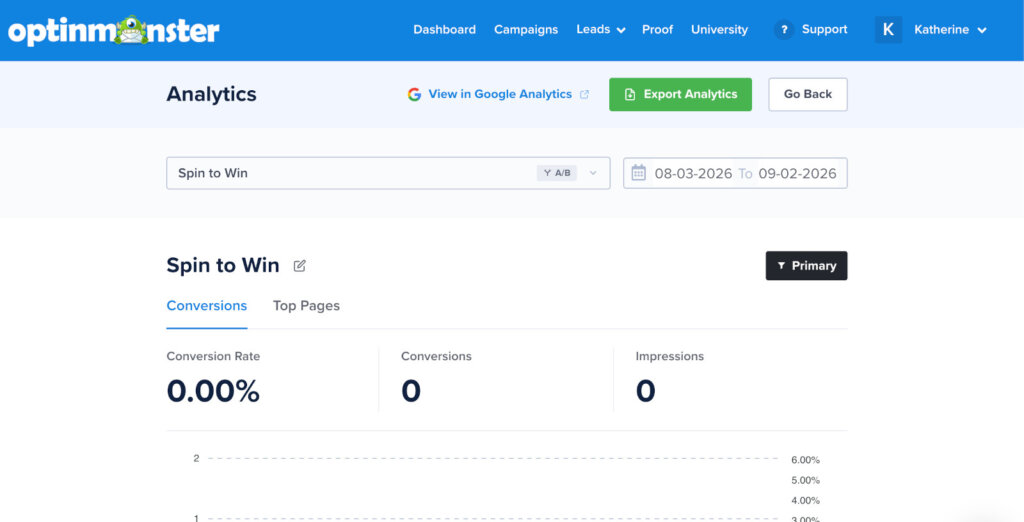
Each split-test variation also gets its own section header, with its own title, Primary tag, and a pencil icon for quick edits.
And there’s a new Top Pages tab in each campaign section, right alongside Revenue and Conversions, which shows each variation’s top-performing pages.
Available Now on Pro and Growth
Analytics Exports is available now on Pro and Growth subscriptions.
Account Owners and Admins can run exports. So if a teammate doesn’t see the Export Analytics button, that’s why.
If you’re already on Pro or Growth, it’s in your dashboard right now. If you’re on Basic or Plus, this is what upgrading unlocks, alongside Revenue Attribution, Exit-Intent®, and the Google Analytics integration.
Analytics Exports vs. Google Analytics Integration: What’s the Difference?
The Google Analytics integration (available on Pro and higher) sends your campaign events into your Google Analytics property. This lets you analyze OptinMonster activity alongside the rest of your website’s data, in Google’s interface and on Google’s terms.
On the other hand, Analytics Exports gives you OptinMonster’s own numbers as a file you control. It comes with campaign-level conversion data, split-test variations broken out per row, and the revenue attributed to each campaign.
If you want OptinMonster events inside your Google Analytics reports, then use the integration. If you want the raw campaign data in a spreadsheet, a client report, or your own dashboard, that’s Analytics Exports, and plenty of accounts will use both.
Run Your First Analytics Export in 5 Steps
- Log in to your OptinMonster dashboard and open the campaign you want data from.
- Click the View Analytics icon in the campaign’s toolbar.
- Click the Export Analytics button at the top of the analytics screen.
- Choose your scope, filters, and columns in the export panel. The row estimate updates as you go.
- Click Export CSV. Your file downloads right away, or we’ll email you a download link if it’s a big one.
For the full walkthrough, see our Analytics Exports documentation.
Your campaign data has been stuck in the dashboard long enough. Go get it.
Ready to build your reports from your own numbers? Get started with OptinMonster Pro today.
Until next time,

Angie and the OptinMonster Team
P.S. Want to see what other marketers do with campaigns like yours? Check out our OptinMonster case studies, complete with winning stats and the exact strategies behind them.